Worksheet: Data Interpretation | Know Your Aptitude Class 6 To 8 - Class 8 PDF Download

Q1: The following weights were bench-pressed by a group of Grade 8 students: 32 kg, 41 kg, 15 kg, 22 kg, and 15 kg.
(i) Find the mean.
(ii) Find the mode.
(iii) Find the median.
(iv) What would be an appropriate graph to use to show this information?
Q2: Is the height of a child, measured every month for the course of three years, continuous or discrete data?
Q3: A survey asked the question, “Do you prefer eating fresh food at Jimmy’s Restaurant or eating stale food at home?” Is this a fair survey question?
Q4: Use the following graphs to answer questions: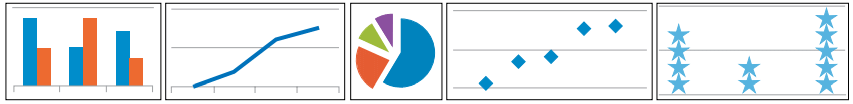
(i) Why would a dot graph better show money earned at a lemonade stand every day than a line graph?
(ii) Which type of graph would best show height comparisons between boys and girls among different grades?
(iii) Which graph would best show percentage of daily time used for different activities?
(iv) Which graph would best show the distance someone travelled over the course of a day?
You can access the solutions to this worksheet here.
|
5 videos|60 docs|13 tests
|
FAQs on Worksheet: Data Interpretation - Know Your Aptitude Class 6 To 8 - Class 8
| 1. What is data interpretation and why is it important in exams? |  |
| 2. How can I improve my data interpretation skills for exams? | |
| 3. What types of questions can I expect in a data interpretation exam? | |
| 4. Are there any specific strategies for tackling data interpretation questions? | |
| 5. How can I manage my time effectively during a data interpretation exam? | |


Worksheet: Data Interpretation | Know Your Aptitude Class 6 To 8 - Class 8
,MCQs
,shortcuts and tricks
,Worksheet: Data Interpretation | Know Your Aptitude Class 6 To 8 - Class 8
,Previous Year Questions with Solutions
,Free
,Important questions
,past year papers
,Summary
,ppt
,Viva Questions
,practice quizzes
,study material
,video lectures
,Sample Paper
,Extra Questions
,Worksheet: Data Interpretation | Know Your Aptitude Class 6 To 8 - Class 8
,mock tests for examination
,Objective type Questions
,Exam
,Semester Notes
;


Worksheet: Data Interpretation Free PDF Download
Importance of Worksheet: Data Interpretation
Worksheet: Data Interpretation Notes
Worksheet: Data Interpretation Class 8 Questions
Study Worksheet: Data Interpretation on the App
|
© EduRev
|
Education Revolution
|


|


