Short Notes: Statistics

Mean [Average]
Mean [Ungrouped Data] - Mean of n observations, x1, x2, x3 ... xn, is![Mean [Average]](https://cn.edurev.in/ApplicationImages/Temp/1421620_58cec880-f358-4df1-8a3e-24a9668f9356_lg.png)
Mean [Grouped Data]
The mean for grouped data can be found by the following three methods:
![Mean [Grouped Data]](https://cn.edurev.in/ApplicationImages/Temp/15154276_5e2819cc-9ace-4b4f-9fa5-5ad23cfcdcb2_lg.png) 1. Direct Mean Method
1. Direct Mean Method
Step 1: Classify the data into intervals and find the corresponding frequency of each class.
Step 2: Find the class mark by taking the midpoint of the upper and lower class limits.
Step 3: Tabulate the product of the class mark and its corresponding frequency for each class. Calculate their sum (∑xifi)).
Step 4: Divide the above sum by the sum of frequencies (∑fi) to get the mean.
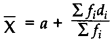
The formula to find the mean using the direct method is:
![Mean [Grouped Data]](https://cn.edurev.in/ApplicationImages/Temp/1421620_1a21d436-c4d3-4efd-a6b4-e1366e92b85b_lg.png)
Class Mark = ![Mean [Grouped Data]](https://cn.edurev.in/ApplicationImages/Temp/1421620_6ac9b1d8-8c9e-4fa2-a7cf-868a9bc393f4_lg.png)
Note: Frequency of a class is centred at its mid-point called class mark.
2. Assumed Mean Method
Step 1: Classify the data into intervals and find the corresponding frequency of each class.
Step 2: Find the class mark by taking the midpoint of the upper and lower class limits.
Step 3: Take one of the xi's (usually one in the middle) as the assumed mean and denote it by ′a′.
Step 4: Find the deviation of ′a′ from each of the x′is
di=xi-a
Step 5: Find the mean of the deviations

Step 6: Calculate the mean as
...[where di = (xi - a)]
Try yourself: What is the formula to find the mean using the direct method for grouped data?
3. Step Deviation Method
Step 1: Classify the data into intervals and find the corresponding frequency of each class.
Step 2: Find the class mark by taking the midpoint of the upper and lower class limits.
Step 3: Take one of the x′is (usually one in the middle) as the assumed mean and denote it by ′a′.
Step 4: Find the deviation of a from each of the x′is
di=xi-a
Step 5: Divide all deviations -di by the class width (h) to get u′is.

Step 6: Find the mean of u′is

Step 7: Calculate the mean as
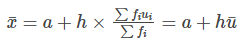
..... [where  , where h is a common divisor of di]
Median
Median of a grouped set of data is calculated as:
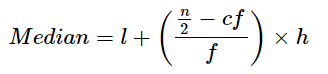
where
'l' is the lower limit of the median class
'n' is the number of observations
'cf' is the class preceding the median class
'f' is the frequency of median class
'h' is the class size
Median class is the class which has the cf value nearer to 2/n
Try yourself: Which method is used to calculate the mean for grouped data by taking one of the xi's (usually one in the middle) as the assumed mean and finding the mean of the deviations?
Mode
1. Ungrouped Data: The value of the observation having maximum frequency is the mode.
2. Grouped Data: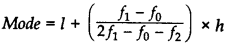
...where[l = Lower limit of modal class; f1 = Frequency of modal class; f0 = Frequency of the class preceding the modal class; f2 = Frequency of the class succeeding the modal class; h = Size of class interval. c.f. = Cumulative frequency of preceding class; h = Class size]
Note: Mode = 3 Median - 2 Mean
FAQs on Short Notes: Statistics
| 1. What is the formula for calculating the mean (average) of a set of numbers? |  |
| 2. How do you calculate the mean for grouped data? | |
| 3. What is the difference between the median and the mean? | |
| 4. How is the mode defined in statistics? | |
| 5. Why is it important to understand measures of central tendency like mean, median, and mode? | |


