Worksheet: Smart Charts - 2 | Worksheets with solutions for Class 4 PDF Download
Q: Answer the following Questions.
(i) There are 400 students in a school. All the students take part in different club see the chapati chart and answer the following :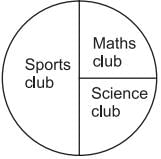 (a) Maths club has _____ students.
(b) Science club has _____ students.
(c) Sports club has _____ students.
(d) Maths club students + Science club students = ______ students.
(ii) Write the shaded part as a fraction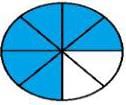
(iii) From the chart find the total numbers of children like the food by them and answer following: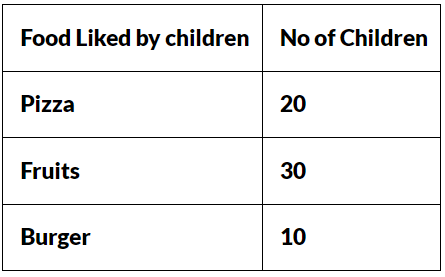
(a) ______ children like fruit
(b) Children who like fruits are 1/3 or 1/2 of the total children. 
(c) Eating Fruit is good. (True/False)
(d) Eating Burger and Pizza is bad. (True/False)
(iv) Write the un-shaded part as a fraction.
(v) From the chart below answer the questions: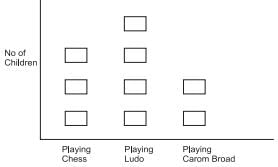 (a) How many children are playing chess?
(b) How many children are playing Ludo?
(c) How many children are playing Carom Board.
(d) It is good to play indoor games during summer vacation. (True/False)
(vi) Find out with the help of the pie chart that in which of the following activity people are spending their most of the times?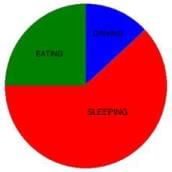
You can access the solutions to this worksheet here.
FAQs on Worksheet: Smart Charts - 2 - Worksheets with solutions for Class 4
| 1. What are smart charts? |  |
| 2. How can smart charts be created? |  |
| 3. What are the benefits of using smart charts? |  |
| 4. Can smart charts be used for forecasting and predictions? |  |
| 5. Are there any limitations or drawbacks to using smart charts? |  |


