Plant Indicators | Botany Optional for UPSC PDF Download
Introduction
Plant indicators are specific plants that reflect the environmental conditions they grow in, serving as a measure of their surroundings. These plants are often referred to as biological indicators or bioindicators.
Some key points to note about plant indicators include:
- Dominant plant species are effective bioindicators because they experience the full impact of their habitat environment over an extended period.
- Larger plant species, covering a wide range of environmental conditions, can also be better bioindicators compared to smaller species.
- Populations of species and entire plant communities are more reliable bioindicators than individual species.
Understanding plant indicators can be valuable for determining the suitability of local soil for various purposes, including crop cultivation, pasture, or other land uses. These indicators can also help in making informed decisions about land resource allocation for activities such as forestry, pastureland, and agriculture. Additionally, certain plants can indicate the presence of specific minerals or metals in their environment, which can be useful for identifying valuable resources.
Plant Indicators for agricultural possibility and soil characteristics
- Plant indicators can be grouped into categories such as those related to agricultural suitability and soil characteristics.
- For instance, when assessing soil suitability for agriculture, experts observe the growth of specific crop plants under different environmental conditions. If a particular soil supports satisfactory crop growth, it is considered suitable for agriculture.
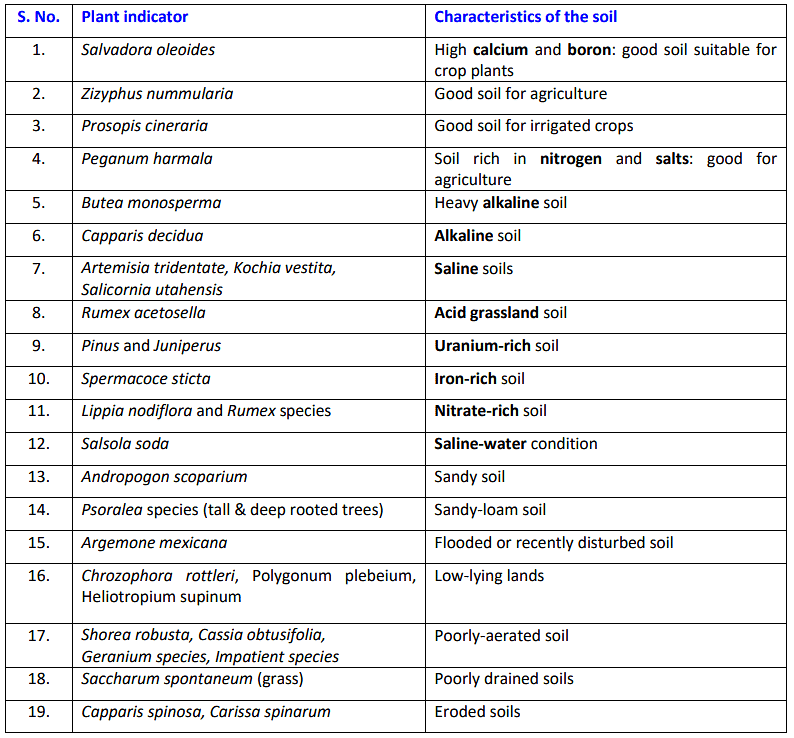
- For example, the presence of short grasses can indicate water scarcity in the soil, while the natural growth of tall and short grasses may suggest fertile soil suitable for agriculture. Examples of such indicators are provided in the table below:
Plant Indicators for different types of soils

Plant Indicators for Land Productivity
Forests serve as valuable indicators of land productivity. For instance, the vegetative growth of forest tree species like Quercus (Q. marilandica, Q. stellata) is meager in infertile lowlands or sterile sandy soil.
Plant Indicators for Climate
Specific traits of plant communities can provide insights into regional climate conditions. For instance:
- Evergreen forests indicate abundant rainfall in both winter and summer.
- Sclerophyllous vegetation (plants with tough leaves and a thick, waxy epidermis) suggests heavy winter rainfall and reduced summer rainfall.
- Xerophytic vegetation, adapted to water scarcity, signifies very low or no rainfall throughout the year.
- Grasslands imply substantial summer rainfall and diminished winter rainfall.
Plant Indicators for Petroleum Deposits
Certain protozoans, such as Fusilinds, can signify the presence of petroleum deposits in the soil.
Plant Indicators for Water Pollution
- Populations of aquatic plants like Utricularia, Chara, and Wolfia indicate polluted water.
- Elevated levels of Escherichia coli bacteria in water suggest water pollution.
- A high population of diatoms in water points to sewage-related water pollution.
- The movement of fish species like Catla catla, Labeo gonius, and Notopterus notopterus away from water indicates industrial water pollution.
Plant Indicators for Ground-Water Depth
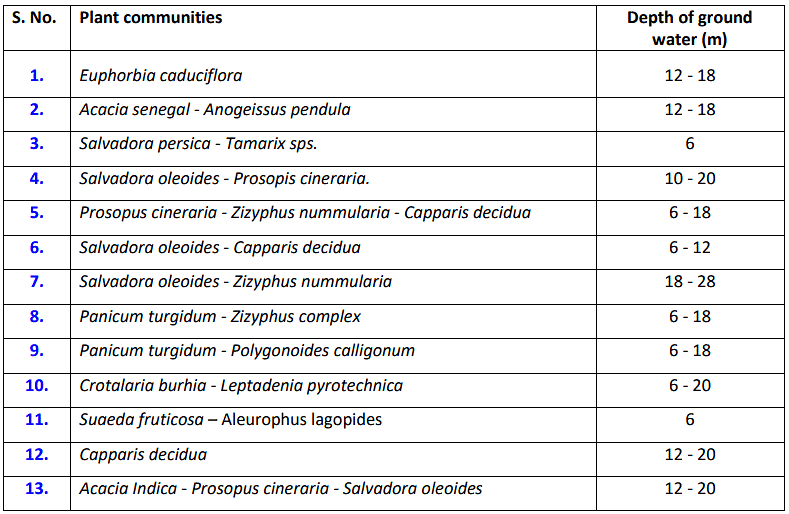
Certain plant communities can provide information about groundwater depth and salinity levels. The Central Arid Zone Research Institute (Jodhpur) has used these indicators. Chatterjee and Bhaskar (1977) listed plant communities as ecological indicators for groundwater assessment in Indian deserts in an accompanying table.
Plant Indicators for ground water depth in indian deserts

Plant Indicators for Overgrazed Conditions
Overgrazing can lead to significant modifications in grasslands. Some plants can serve as indicators of overgrazing, as they exhibit distinct characteristics in such conditions. For instance:
- Severe grazing is indicated by the prevalence of annual weeds and short-lived, unpalatable perennials. Examples include Polygonum, Chenopodium, Lepidium, and Verbena.
- Some plants are less affected by overgrazing and show minimal signs of disturbance. Examples include Opuntia, Grindelia, and Vernonia.
Plant Indicators of Forest Types
Certain plants can indicate specific forest types when they grow undisturbed in an area. Knowing which forest plants thrive in particular soil types can enhance forest productivity. Examples include:
- Narenga porphyrocoma, a soil-binding grass, suggests suitable conditions for cultivating Sal (Shorea robusta).
- Viola species in the western Himalayas can serve as an indicator for planting Cedrus deodara and Pinus wallichiana.
- Quercus stellata and Quercus mariandica grow in various environments, including upland, lowland, and sterile sandy soils.
Plant Indicators for Soil Humus Status
Certain plants act as indicators of soil humus content. For instance:
- Monotropa, Neottia, and mushrooms suggest the presence of humus in the soil.
- Strobilanthes and Impatiens species indicate a high humus or litter presence in the soil, which can hinder tree species regeneration.
Plant Indicators for Soil Moisture Status
Plants can indicate soil moisture levels. For example:
- Some plants like Sacchamm munja, Acacia nilotica, Calotropis, Agave, Opuntia, and Argemone prefer arid conditions, indicating low soil moisture.
- Eucalyptus can lower the water table, suggesting a low water table.
- Typha, Phragmites, Vetiveria indicate waterlogged soil.
- Mangrove vegetation and Polygonum thrive in waterlogged saline soils.
Plant Indicators for Soil Texture-Type
Certain plants are indicative of specific soil types. For instance:
- Casuarina equisetifolia, Ipomoea pes-caprae, Citrullus colocynthis, Calligonum polygonoides, Lycium barbarum, and Panicum grow in sandy soil.
- Sacchamm munja prefers sandy-loam soil.
- Imperata cylindrica and Vetiveria zizanioides thrive in clayey soils.
- Cotton prefers black soil.
Plant Indicators for Soil pH
Plants can indicate soil pH levels (acidity or alkalinity). For example:
- Rumex acetosa, Rhododendron, Polytrichum, and Sphagnum suggest acidic soils.
- Some forest trees like Shorea robusta and Pinus roxburghii grow in calcium-rich soils.
- Tectona grandis (teak), Cupressus torulosa, Ixora parviflora, and Taxus baccata are indicative of lime-rich soil.
- Certain mosses, such as Tartulla and Neckera, thrive on limestone.
- Halophytes like Suaeda fruticosa, Tamarix auriculata, Salicornea, Chenopodium, and Salsola foetida grow in salty soil.
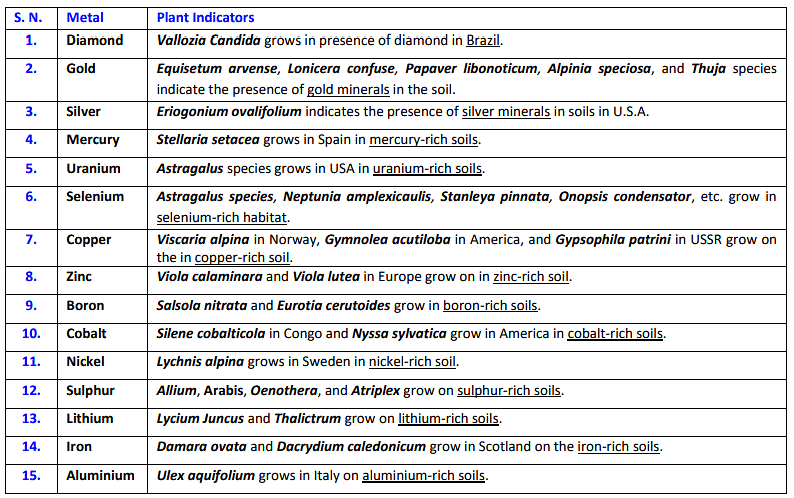
Plant Indicators for Minerals
Certain plants, known as metallocoles or metallophytes, indicate the presence of specific minerals in the soil. These plants can grow in the presence of particular metals.
Certain plants have been identified as containing valuable metals like silver and gold in their leaves. In Turkey, it was discovered that Helichrysum arenarium plants possess these precious metals in their foliage, opening up possibilities for biochemical mining.
The mineral content in plant tissue can be employed as an indicator of environmental pollution. Specific examples include:
- Olearia rani indicating molybdenum levels in soil (Lyon and Brooks, 1969).
- The sulfate content of Myoporum pictum leaves serving as a direct indicator of SO2 concentration in the air (Al-Jahdali & Bin Bisher, 2008).
- High sulfur content in pine needles suggesting a high atmospheric SO2 concentration (Farrar, 1977).
- Fluoride content in Sorghum vulgare leaves indicating the distance from a fluoride pollution source (up to 4 km).
- Elevated copper content in plants possibly due to the presence of high-tension copper wires.
- Mercury concentration in Festuca rubra grass possibly linked to the presence of a chloroalkali plant using electrodes (Henry, 2000).
- Lead levels in leaves potentially increasing due to automobile exhaust (Smith, 2008).
Plant Indicators for Fire-Affected Areas
Certain plants are adapted to thrive in areas that have experienced fires and significant disturbances. Examples include Agrostis hiemalis, Epilobium spicatum, Populus tremuloides, Pteris aquilina (fern), and Pyronema confluens (fungus).
Plant Indicators for Petroleum Deposits
Protozoans, such as Fusilinds, can serve as indicators of the presence of petroleum deposits in an area.
Plant Indicators for Environmental Pollution
- The utilization of vegetation as a biological indicator of environmental pollution has a rich history. Plants grown in industrial or densely populated areas can demonstrate specific resistance to prevalent pollutants in those regions.
- Plant species exhibit varying degrees of sensitivity to pollutants. In general, plants tend to be more sensitive to pollutants than humans. Consequently, plants can serve as valuable bioindicators of environmental pollution. Sensitive plant species can serve as indicators, while more resistant species can accumulate pollutants without sustaining damage. Mosses, lichens, and certain fungi, for example, display high sensitivity to substances like sulfur dioxide (SO2) and various halides, including fluoride (F−), chloride (Cl−), bromide (Br−), iodide (I−), and astatide (At−). Even a modest 1% concentration of SO2 can harm higher plants, and lichens typically do not thrive in areas subjected to prolonged SO2 exposure.
- Numerous chemicals, fertilizers, pesticides, and fossil fuels release toxic substances into the environment, which plants then absorb from the air, water, and soil. Atmospheric pollutants, notably SO2, halides (e.g., HF, HCl), ozone, and peroxyacetyl-nitrate (PAN), produced by automobiles, industrial facilities, and intense radiation, pose risks to plants. Harmful substances reach plants via the air and include SO2, nitrogen oxides, hydrocarbons, dust, and smoke. Plants growing in aquatic environments are particularly vulnerable to toxic chemicals such as cyanide, chlorine, hypochlorate, phenols, benzyl derivatives, and heavy-metal compounds found in sewage.
- The effects of various types of pollution depend on the nature of the pollutants, their concentrations, and the duration of exposure. High concentrations of pollutants can result in acute damage to plants, manifested through visible symptoms such as chlorosis, discoloration, necrosis, and the death of entire plants. In addition to morphological changes, plants also undergo biochemical, physiological, and fine structural alterations.
Pollution damage can manifest in various ways:- Accumulation of toxic substances within the plant.
- Alterations in soil or water pH.
- Changes in the activity levels of specific enzymes.
- Increases in compounds with sulfhydryl (SH) groups and phenols.
- Reduced levels of ascorbic acid in the leaves.
- Decreased photosynthesis.
- Stimulation of respiration.
- Lower production of dry matter.
- Changes in membrane permeability.
- Disruptions in water balance.
- Reduced fertility with prolonged exposure.
- Disturbances in plant metabolism due to chronic injury.
- Diminished productivity, yield, and quality.
- Altered wood structure.
- Desiccation of branches and gradual plant death.
- Symptoms of pollution-related plant damage are diverse and nonspecific. Different pollutants affect various plants in distinct ways, and a particular symptom can result from exposure to various substances. The impact of external factors (pollutants) on plants is influenced by factors such as species, developmental stage, and the specific organ or tissue involved.
- Common indicators of environmental changes due to pollution include morphological changes in plants and alterations in the floristic composition of plant communities. Visible plant symptoms are frequently employed to assess plant responses to pollutants, as per Van Haut and Stratmann (1970). Jacobson and Hill (1970) have conducted studies on the effects of common pollutants on plants.
- In practice, any part of a plant that responds specifically or characteristically to a pollutant can potentially serve as a plant indicator for that particular pollutant. The choice of biological indicators can be categorized based on decreasing biological complexity, encompassing organisms, organs, tissues, cells, cell-free preparations, and enzymatic studies (Goldstein, 1974).
- M.U. Beg (1980) from the Industrial Toxicology Research Centre in Lucknow has extensively examined plant responses to pollutants as a biological indicator, considering multiple parameters. Efforts have also been made to leverage specific structures and functions of plants as indicators of pollution-induced stress. These plant responses or parameters include seed germination, plant growth, lateral branch development, leaf expansion and color changes, flower and fruit formation, flower discoloration, loss of physiological control, mineral composition, chemical constituents of cells, enzymatic activity, and pollen germination.
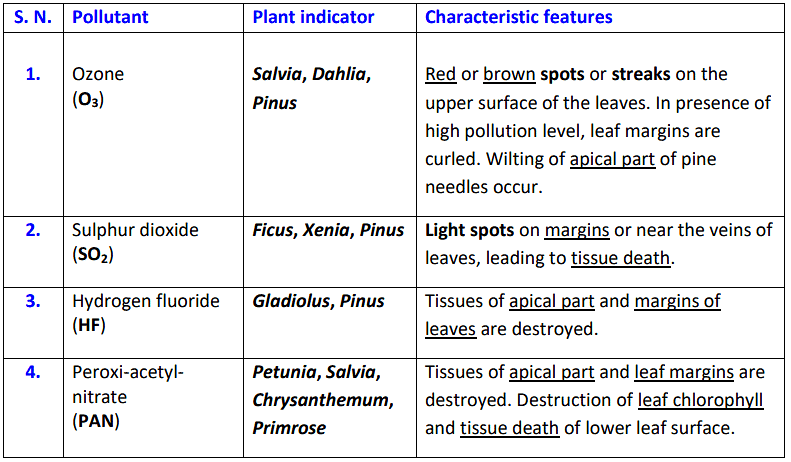
Plant Indicators characterized by plant responses to specific pollutants

- Numerous researchers have employed seed germination and various growth parameters as tools to assess pollution-induced plant responses. These parameters include the percentage of germination, seedling survival, seedling height, cotyledon expansion, and fresh and dry weight. For instance, Sorauer (1899) conducted experiments with Phaseolus vulgaris in both smoke-free and smoke-affected areas, demonstrating its potential as an indicator for the detrimental effects of smoke.
- Thiosulfate's toxic effect as a germination inhibitor has been observed in many plant species. Houstan and Dochinger (1977) investigated germination inhibition in relation to pollution caused by sulfur dioxide and ozone. Additionally, the adverse effects of pollutants like lead, cadmium, nitrogen oxide (NO), and carbon dioxide (CO2) have been studied in various plant species. Apart from seed germination, pollen germination in Nicotiana sylvestris has been used as an indicator of pollution (Wolters, 1987).
- Certain plant species have proven to be reliable indicators of pollution. Polygonum, Rheum, Vicia, Phaseolus, and Capsella have been identified as indicators of pollution (Brandt, 1974).
Pollution-induced changes in plant growth have been observed and documented:- Stunted vertical growth in crops such as corn, sweet potato, and rye due to high pollutant toxicity.
- Reduction in root and shoot length, the number of tillers, leaves, ears, and grains per ear in wheat exposed to cement dust pollution.
- Decreased plant height, number of leaves, and bolls per plant in cotton plants subjected to particulate pollution.
- Inhibition of lateral growth in forest trees caused by limestone dust.
- Inhibition of Pine tree growth observed in areas polluted by sulfur dioxide (SO2).
- Leaves have been recognized as the most sensitive plant organ to pollution. Researchers have explored the indicator value of leaves in response to various environmental changes. Leaf injury is a characteristic symptom triggered by a range of pollutants, and symptoms induced by ozone, nitrogen oxides, and chlorine are often similar:
- Changes in pigmentation, such as chlorosis and yellowing, as well as necrosis.
- Dicotyledonous leaves typically exhibit spotted markings between veins, while monocotyledons tend to show necrotic streaks between parallel veins.
- Injury may also manifest along leaf margins and tips.
- Reduced expansion of cotyledonary leaves has been observed in response to pollution in several instances.
- More recently, epidermal morphology has been studied as an indicator of various pollutants, particularly SO2. Examples of findings in this area include:
- Cuticular and epidermal damage serving as indicators of air pollution.
- Decreased leaf thickness, cell size, and overall leaf dry weight, as well as leaf loss and premature senescence attributed to smoke and SO2 pollution.
- Yunus and Ahmad (1980) noted that leaves in areas polluted by cement factory emissions exhibited higher stomatal and trichome densities, along with smaller epidermal cells and trichomes, compared to leaves from unpolluted environments.
Biochemical and Physiological Alterations as Pollution Indicators
- The chemical composition of leaves has been extensively employed to signify environmental conditions. Within biochemical assessments, pigment analysis holds significant importance, with chlorophylls a and b serving as key indices for gauging responses to various types of pollution.
- In Cassia and Cynodon, a 5% reduction in chlorophyll content has been observed, while Saccharum displays the least impact on pigments.
- Other chemical estimations, such as proteins, amino acids, soluble sugars, sucrose, starch, reducing sugars, vitamin C, riboflavin, thiamine, and carbohydrates, are also utilized to indicate foliar sensitivity to air pollution.
- Physiological activities, including stomatal opening and photosynthesis rates, can further serve as pollution indicators. Photosynthesis, as a parameter of pollution response, has been employed in scenarios involving mixed exposure to SO2, NO2, and dust.
- Enzymatic parameters are another avenue for pinpointing the presence of specific pollutants. For example, the enzyme peroxidase has been identified as the most sensitive indicator of pollutants in the absence of visible injury.
- Kellar (1974) and Jager (1975) reported distinct responses of enzymes in areas affected by fluoride, automobile pollution, and SO2. Thus, by assessing enzyme activity, susceptible plant species can be identified. Numerous studies have linked enzymatic activity to air pollution. Additional enzymatic parameters commonly utilized include ribulose diphosphate carboxylase, glutamate-pyruvate transaminase, glutamate-oxaloacetate transaminase, and peroxidase in the context of SO2 pollution.
|
179 videos|143 docs
|


