Correlation and Regression | Botany Optional for UPSC PDF Download
| Table of contents |

|
| Introduction |

|
| Background |

|
| Scatter Plot |

|
| Correlation |

|
| Regression |

|
| Standard Error |

|
Introduction
Correlation and regression, as intricate and potent statistical techniques, hold a pivotal role in the realm of data analysis. This article delves into the fundamental concepts of correlation and regression, elucidating their importance and practical application. Focusing primarily on basic linear correlation and regression techniques, it aims to unravel the complexities of these statistical tools.
Background
Correlation and regression serve as indispensable tools for understanding relationships between continuous variables. In this context, the dependent variable, often denoted as Y, represents the outcome under investigation, while the independent variable, denoted as X, acts as the predictor.
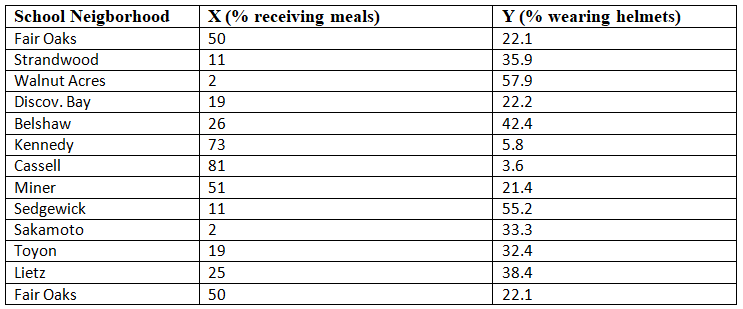
To illustrate these concepts, let's consider the dataset BICYCLE.SAV, sourced from a study on bicycle helmet usage (Y) and socioeconomic status (X). Here are the data points:
Scatter Plot
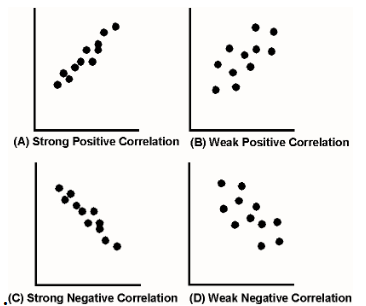
 Both correlation and regression find their roots in the world of scatter plots, which depict the relationship between variables through a graphical representation. In our case, this scatter plot reveals a negative correlation. As X (percentage of children receiving meals) increases, Y (percentage of bicycle riders wearing helmets) decreases.
Correlation
Pearson's Correlation Coefficient (r)
 Pearson's correlation coefficient, denoted as "r," quantifies the strength and direction of the relationship between X and Y. It ranges from -1 to 1, where -1 indicates a perfect negative correlation, 1 denotes a perfect positive correlation, and 0 implies no correlation.
 For our dataset, r = -0.849, indicating a strong negative correlation.
Regression
Regression Model
The primary goal of regression is to establish a predictive line that captures the average change in Y per unit change in X. This endeavor involves determining the intercept (a) and slope (b) of the regression line. In the equation E(Y|x) = a + bx, "a" represents the intercept, while "b" signifies the slope.
Slope Estimate
The slope (b) is determined by the formula b = ssxy / ssxx, where ssxy represents the sum of cross-products, and ssxx represents the sum of squares for variable X. For our dataset, b = -0.54, indicating that each unit increase in X is associated with a 0.54 decrease in Y, on average.
Intercept Estimate
The intercept (a) is calculated as a = "y bar" - bx, where "y bar" is the average of all Y values. For our dataset, a = 47.49.
Predicting Values of Y
With the intercept and slope known, predicting Y for a given X is straightforward. The regression model for our dataset is:
Predicted helmet use rate (Y^) = 47.49 - 0.54X
Standard Error
Standard Error of the Regression
The standard error of the regression (sYX) quantifies the accuracy of the regression line in predicting the relationship between Y and X. It is calculated as:
sYX = sqrt[(ssyy - b * ssxy) / (n - 2)]
For our dataset, sYX = 9.38.
Standard Error of the Slope
The standard error of the slope estimate (seb) is determined by:
seb = sYX / sqrt(ssxx)
For our dataset, seb = 0.1058.
Significance Testing
To test the significance of the slope, a t-statistic is computed using the formula:
t-stat = b / (seb)
For our dataset, t-statistic = -5.10 with 10 degrees of freedom, suggesting a significant relationship between X and Y.
Assumptions
Valid regression and correlation inferences rely on several assumptions, including linearity, independence, normality, and equal variance. These assumptions ensure the reliability of the statistical analyses.
Importance of Visualization in Data Analysis
The provided information underscores the critical role of visualization in data analysis, particularly when dealing with regression analysis and interpreting statistical results.
Here are the key points highlighting the importance of visualization:
- Identifying Patterns: Visualizations, such as scatter plots, allow analysts to visually identify patterns, trends, and anomalies within the data. In the absence of visualization, these nuances may go unnoticed.
- Avoiding Nonsensical Results: As demonstrated with Anscombe's quartet, relying solely on regression statistics like correlation coefficients and regression equations can lead to misleading or nonsensical conclusions. Visualization helps in verifying if the model assumptions are met and if the chosen regression model accurately represents the data.
- Diverse Relationships: The quartet example illustrates that datasets with identical statistical measures can exhibit entirely different relationships when visualized. This highlights the need to complement statistical analysis with visual exploration to gain a comprehensive understanding of the data.
- Outlier Detection: Visualizations are instrumental in spotting outliers, which can significantly influence regression results. Outliers may not always be apparent through statistical calculations alone.
- Model Validation: Visualization aids in model validation by allowing analysts to assess how well the regression model fits the data. It can reveal whether the chosen model adequately captures the underlying relationships or if more complex models are needed.
- Effective Communication: Visualizations make it easier to communicate findings and insights to a broader audience, including stakeholders who may not be well-versed in statistics.
- Data Exploration: Before conducting regression analysis, visual exploration of the data helps analysts form hypotheses, refine research questions, and select appropriate variables for analysis.
Conclusion
Correlation and regression are powerful tools for understanding relationships within data. This article has provided an in-depth exploration of these techniques, from scatter plots and correlation coefficients to regression models and significance testing. Understanding and applying these methods can provide valuable insights into various fields of study, from social sciences to economics and beyond.
|
179 videos|140 docs
|

|
Explore Courses for UPSC exam
|

|


