Final Revision: Logical Reasoning & Data Interpretation For CAT | Reasoning Aptitude for Competitive Examinations - Bank Exams PDF Download
| Table of contents |

|
| Seating Arrangement |

|
| Syllogism |

|
| Venn Diagrams & Set Theory |

|
| Pie Chart |

|
| Caselets |

|
| Data Sufficiency |

|
| Clock and Calendars |

|
| Puzzles |

|
| How to Prepare for CAT DILR? |

|
This document is like a guidebook to help you review all the important stuff about DILR topics. It's packed with simple explanations and examples to make it easy for you to understand and improve your skills. Whether you need a quick refresher or want to learn more, this document has got you covered!
Seating Arrangement
There is no set formula for solving the seating arrangement questions but there is a sort of set systematic logical approach for solving these. To exemplify this approach consider the following question:

Q: Eight friends: Ajit, Byomkesh, Gargi, Jayanta, Kikira, Manik, Prodosh and Tapesh are going to Delhi from Kolkata by a flight operated by Cheap Air. In the flight, sitting is arranged in 30 rows, numbered 1 to 30, each consisting of 6 seats, marked by letters A to F from left to right, respectively. Seats A to C are to the left of the aisle (the passage running from the front of the aircraft to the back), and seats D to F are to the right of the aisle. Seats A and F are by the windows and referred to as Window seats, C and D are by the aisle and are referred to as Aisle seats while B and E are referred to as Middle seats. Seats marked by consecutive letters are called consecutive seats (or seats next to each other). A seat number is a combination of the row number, followed by the letter indicating the position in the row; e.g., 1A is the left window seat in the first row, while 12E is the right middle seat in the 12th row.
Cheap Air charges Rs. 1000 extra for any seats in Rows 1, 12 and 13 as those have extra legroom. For Rows 2-10, it charges Rs. 300 extra for Window seats and Rs. 500 extra for Aisle seats. For Rows 11 and 14 to 20, it charges Rs. 200 extra for Window seats and Rs. 400 extra for Aisle seats. All other seats are available at no extra charge.
The following are known:
1. The eight friends were seated in six different rows.
2. They occupied 3 Window seats, 4 Aisle seats and 1 Middle seat.
3. Seven of them had to pay extra amounts, totalling to Rs. 4600, for their choices of seats. One of them did not pay any additional amount for his/her choice of seat.
4. Jayanta, Ajit and Byomkesh were sitting in seats marked by the same letter, in consecutive rows in increasing order of row numbers; but all of them paid different amounts for their choices of seat. One of these amounts may be zero.
5. Gargi was sitting next to Kikira, and Manik was sitting next to Jayanta.
6. Prodosh and Tapesh were sitting in seats marked by the same letter, in consecutive rows in increasing order of row numbers; but they paid different amounts for their choices of seat. One of these amounts may be zero.
How much extra did Gargi pay for her choice of seat?
Option A: Rs.0
Option B: Rs.300
Option C: Rs.500
Option D: Rs.1000
Sol: Let us draw a simple diagram and visualize this.
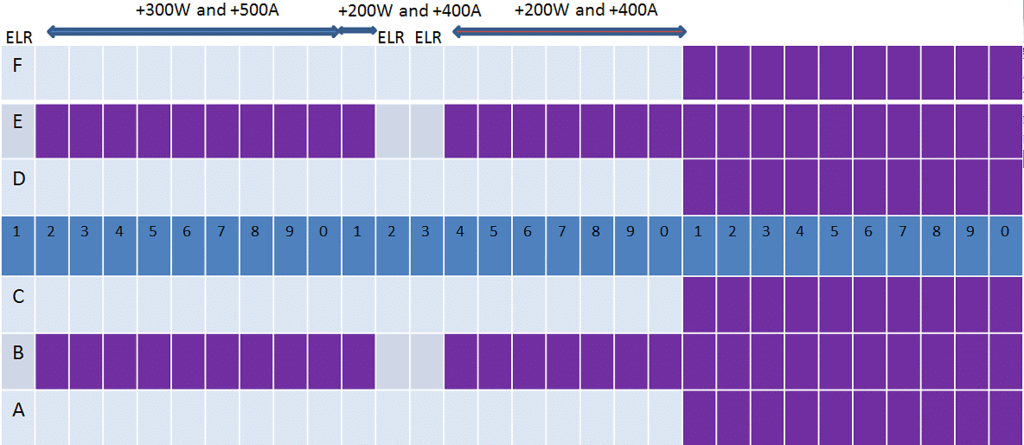
4. Jayanta, Ajit and Byomkesh were sitting in seats marked by the same letter, in consecutive rows in increasing order of row numbers; but all of them paid different amounts for their choices of seat. One of these amounts may be zero.
Where should these three be? J, A and B should be in rows 10, 11 and 12 and should be window or aisle seats.
J = Row 10, A = Row 11, B = Row 12. All three aisle or all three window.
6. Prodosh and Tapesh were sitting in seats marked by the same letter, in consecutive rows in increasing order of row numbers; but they paid different amounts for their choices of seat. One of these amounts may be zero.
Where should these two be? They could be in rows 1 and 2, 13 & 14, or 20 & 21. They should be aisle seats if JAB take window . Window seats in JAB take aisle seats.
5. Gargi was sitting next to Kikira, and Manik was sitting next to Jayanta.
If seats are adjacent to each other, either they should both be aisle seats or we should have a middle seat involved.
So, JAB were aisle seats, then Manik also had to be an aisle seat, and GK had to be a window and middle seat. In which case P&T would have window seats
If JAB have window seats, M would have to have a middle seat. GK would have to be two aisle seats and PT would have to take two aisle seats.
Possibility 1 = JABM Aisle in row number 10, 11, 12 and 10
GK = window and middle seats, PT = two window seats.
Possibility 2 = JABM seated in 3 window seats and a middle seat row number 10, 11, 12 and 10
GK = aisle seats, PT = two aisle seats.
3. Seven of them had to pay extra amounts, totalling to Rs. 4600, for their choices of seat. One of them did not pay any additional amount for his/her choice of seat.
4600 across 7 members. This is a lot of extra money. There has to be at least one Rs. 1000 extra. This leaves 3600 across 6 members. An average of Rs. 600 extra per person. This is also high. This tells us that there should have been two folks paying Rs. 1000 extra. So, we have Rs. 1000, Rs. 1000 and Rs. 2600 distributed across 5 people. This also averages out to more than Rs. 500. This tells us that we should have had 3 people paying Rs. 1000 extra. So, we have Rs. 1000, Rs. 1000, Rs, 1000 and Rs. 1600 across 4 people. So, we could have someone sitting in rows 1, 12 and 13. We also have folks in 10 and 11.
5. Gargi was sitting next to Kikira, and Manik was sitting next to Jayanta.
Possibility 1 = JABM Aisle in row number 10, 11, 12 and 10
GK = window and middle seats, PT = two window seats.
Extra charge for JABM = 500+400+1000+500 = 2400
3 out of the other 4 should give 2200 – this should be 1000 + 1000 + 200. Or, GK could be Rs. 1000 seats in, row 13 or row 1. and PT could have window seats in rows 20 and 21.
Possibility 2 = JABM seated in 3 window seats and a middle seat row number 10, 11, 12 and 10
GK = aisle seats, PT = two aisle seats.
Extra charge for JABM = 300+200+1000+0 = 1500
The other 4 should add up to 3100. This should be as 1000 + 1000 + remaining. The remaining two cannot add up to 1100. So, this possibility can be eliminated.
Final State
JABM Aisle in row number 10, 11, 12 and 10
GK = window and middle seats in row 1 or row 13
PT = two window seats in rows 20 and 21.
Extra charge for JABM = 500+400+1000+500 = 2400
Extra charge for G and K = 1000 + 1000 = 2000
Extra charge for P and T = Rs. 200 + 0.
G and K sat in window and aisle seats of row 1 or 13. So, an additional amount of Rs. 1000 was paid.
The question is "How much extra did Gargi pay for her choice of seat?"
Hence, the answer is "Rs.1000".
Ans: Choice D is the correct answer.
Syllogism
CAT syllogism questions involve reading a bunch of sentences and then figuring out a conclusion based on them. It's like solving a puzzle where you use logical thinking to reach an answer. So, basically, syllogism is about finding a conclusion by carefully thinking through the information given.
- Some + All= Some
- Some + Some= No Conclusion
- Some + No= Some Not
- No + No= No Conclusion
- No +All = Some Not Reversed
- No + Some = Some Not ( Reversed )
- Some Not/ Some Not Reversed + Anything= No Conclusion
- No + All = Some not Reversed
- All + Some = No Conclusion
- All + All= All
- All + No= No
Formulas for Syllogism and Concept
To understand the syllogism formulas it is important to understand the below 4 points. Before stating further.
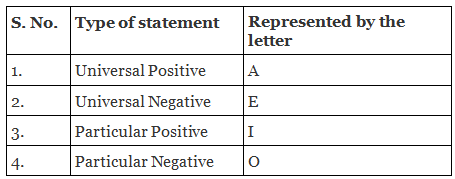
Universal Positive Statement:
Universal positive statement indicates something positive applicable to all the items in that category. This is represented by the letter ‘A’. These statement begin with All, Every and Even.
Universal Negative Statement:
It implies that it refers to that kind of statements, which are universal and giving a negative impression. These types of statements begin with No, None of the, Not a single etc. and are represented by the letter ‘E’
Particular Positive Statement:
These type of statements begins with some, any, a few and are represented by the letter ‘I’.
Particular Negative Statement:
These kinds of statements are represented by the letter ‘O’. Some examples of this are:
- Some girls are not crazy
- Some files are not pencils
- Some M is not N
- Some Rohits are not Dhawans.
- Few vegetables are not green.
Q: Which of the two conclusions can be concluded on the basis of given statements?
Statements:
All flowers are candles.
All lanterns are candles.
Conclusions:
Some flowers are lanterns.
Some candles are lanterns.
Solution: Three possible diagrams is show in the above for the given statements.
Conclusion I follows from last two possible solutions, but does not follow from the first possible solution. Therefore, this conclusion is false.
Conclusion II follows from all the three possible solutions.

Ans: Therefore, conclusion II is true.
Venn Diagrams & Set Theory
- Its one of the easiest topics of CAT.
- Most of the formulae in this section can be deduced logically with little effort.
- The difficult part of the problem is translating the sentences into areas of the Venn diagram.
- While solving, pay careful attention to phrases like and, or, not, only, in as these generally signify the relationship.
- Set is defined as a collection of well defined objects. Ex. Set of whole numbers
- Every object is called Element of the set.
- The number of elements in the set is called cardinal number
Types of Sets
1. Null set: A set with zero or no elements is called Null set. It is denoted by or Ø. Null set cardinal number is 0
2. Singleton set: Sets with only one element in them are called singleton sets. Ex. { 2},{ a},{0}
3. Finite and Infinite set: A set having finite number of elements is called finite set. A set having infinite or uncountable elements in it is called infinite set.
4. Universal set: A set which contains all the elements of all the sets and all the other sets in it, is called universal set.
5. Subset: A set is said to be subset of another set i f all the elements contained in it are also part of another set. Ex. If A = {1,2}, B = {1,2,3,4} then, Set “A” is said t o be subset of set B.
6. Equal sets: Two sets are said to be equal sets when they contain same elements
Ex. A = {a, b, c } and B = {a, b, c } then A and B are called equal
7. Disjoint sets: When two sets have no elements in common then the two sets are called disjoint sets
Ex. A = {1,2,3} and B = {6,8,9} then A and B are disjoint sets.
8. Power set:
- A power set is defined as the collection of all the subsets of a set and is denoted by P(A)
- If A = { a, b } then P(A) = { { }, {a}, {b}, {a, b}}
- For a set having n elements, the number of subsets are 2n
Properties of Sets:
- The null set is a subset of all sets
- Every set is subset of itself
- A U (BUC) = (AUB) U C
- A ∩ (B C ) = A B ) C
- A U B C ) ==(AUB) ∩ AUC)
- A BUC ) = A B ) U (A C)
- A U Ø = A
Venn diagrams:
A Venn diagram is a figure to represent various sets and their relationship.
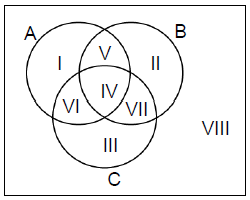
I,II,III are the elements in only A, only B and only C respectively
IV- Elements which are in all of A, B and C.
V- Elements which are in A and B but not in C.
VI - Elements which are in A and C but not in B.
VII - Elements which are in B and C but not in A.
VIII- Elements which are not in either A or B or C.
Union of sets is defined as the collection of elements either in A or B or both. It is represented by symbol “U”. Intersection of set is the collection of elements which are in both A and B.
- Let there are two sets A and B then,
n(AUB) = n(A) + n(B) n(A ∩ - If there are 3 sets A, B and C then
n(AUBUC) = n(A) + n(B) + n(C) n(A ∩ n(B ∩ n(C ∩A) + n(A ∩B∩
To maximize overlap,
- Union should be as small as possible
- Calculate the surplus = n (A ) + n (B) + n (C ) n AUBUC)
- This can be attributed to n (A∩B∩C ′), n (A∩B′∩C n (A′∩B∩C ), n (A∩B∩C).
- To maximize the overlap, set the other three terms to zero.
To minimize overlap
- Union should be as large as possible
- Calculate the surplus = n (A ) +n(B) +n(C ) n (
- This can be attributed to n(A∩B∩C ′), n (A∩B′∩ n (A′∩B∩ n (A∩B∩C).
- To minimize the overlap, set the other three terms to maximum possible.
Some other important properties
- A’ is called complement of set A, or A’ = U A
- n( A B) = n( A) n( A∩B)
- A B A∩B’
- B A = A’∩B
- (A B) U B = A U B
Q: A club has 256 members of whom 144 can play football, 123 can play tennis, and 132 can play cricket. Moreover, 58 members can play both football and tennis, 25 can play both cricket and tennis, and 63 can play both football and cricket. If every member can play at least one game, then the number of members who can play only tennis is
Option A: 32
Option B: 43
Option C: 38
Option D: 45
Answer: Option B
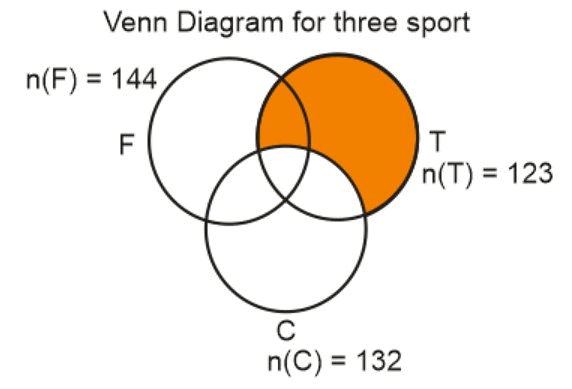
n(FUTUC) = 256; n(F) = 144; n(T) = 123; n(C) = 132; n(F∩T) = 58; n(C∩T) = 25; n(F∩C) = 63
Also, we know that
We know that (AUBUC) = n(A) + n(B) +n(C) - n(A∩B) - n(B ∩C) - n(C∩A) + n(A ∩B∩C)1695626457618
So, 256 = 144 + 123 + 132 - 58 - 25 - 63 + n (F T ∩C)n (F∩T∩C) = 256 - 253 = 3
So, number of students who play Table Tennis only = n(T) – n(F∩T) – n(T∩C) + n(F∩T∩C)
Number of students who play Table Tennis only = 123 – 58 – 25 + 3 = 43
Pie Chart
- Calculating absolute value from degree or percentage – Application of percentage-based questions which are quite simple to calculate. It could be possible that absolute value is given, and students have to calculate the degree or percentage.
- Calculating degree from given percentage- Again a simple concept of converting 100% to 360 degrees.
- Percentage increase or decrease – Data will be given for 2 different time period and the candidate needs to calculate the percentage change.
- Questions with multiple pie chart- Candidates will have to analyse data given in multiple chart and try to relate the data.
- Questions with pie chart and other graphs – CAT, XAT, SNAP, tend to present data with a chart and some other bar graph, line graph, table etc.
- Multi-layered Pie chart – The level of difficulty with this concept may be high as the data is complicated and detailed.
Tips to Solve Pie Charts Questions for CAT
- You can solve Pie chart based problems by understanding circle properties and learning about the basic concept of percentage.
- A 360 degree corresponds to 100 per cent.
- To work on a pie chart, consider the size of the angle, i.e. degrees, the value of slice and the total sum of values in a slice.
- Round off to the nearest whole number, fractional equivalent or per cent to ensure the equation is easy to solve.
Q: Answer the questions based on the pie charts given below.
Chart 1 shows the distribution of 12 million tonnes of crude oil transported through different modes over a specific period of time.
Chart 2 shows the distribution of the cost of transporting this crude oil. The total cost was Rs. 30 million.

The cost in rupees per tonne of oil moved by rail and road happens to be roughly
a) Rs. 3
b) Rs. 1.5
c) Rs. 4.5
d) Rs. 8
Answer: (b)
Total tonnes of transportation by both rail and road is about 31*12/100 = 3.72 million tonnes and total cost incurred 18*30/100 = 5.4 .
Hence the required value is 5.4/3.72 which is about 1.5.
Hence option B.
Caselets
Caselet can be of two forms:
- Paragraph based on Reasoning.
- Paragraph based on numerical Data.

Now to understand how to interpret the data we will use examples and try to find a step-wise solution that may help to solve Caselet questions in the exam. Before hopping on to examples keep in mind the following points that will assist you while devising a solution to the problem of Caselet.
- Read the paragraph carefully and recognize the variables around which the whole paragraph revolves and questions are asked. Note down all the important points.
- Try to formulate relationships between the variables pictographically using tables, symbols or Venn diagrams. Tables help to define multivariate relationships more clearly so try using them more often.
- Data interpretation usually requires numerical and arithmetic calculations such as averages, ratios, percentages etc. Be thorough with their concepts and use shortcuts and tricks for faster calculations, it will save you a lot of time.
- Do not assume information that is not given and use logic and reasoning to find out the hidden information that is given in paragraph.
- Do not indulge into troublesome lengthy calculations when approximations or relative values are asked. Calculate only what is asked.
1. Paragraph based on Reasoning
Now let’s move on to an example first of paragraph based on reasoning. Consider this question.
In a sports event, six teams (A, B, C, D, E, and F) are competing against each other. Matches are scheduled in two stages. Each team plays three matches in stage – I and two matches in Stage – II. No team plays against the same team more than once in the event. No ties are permitted in any of the matches. The observations after the completion of Stage – I and Stage – II are as given below.
Stage-I:
- One team won all the three matches.
- Two teams lost all the matches.
- D lost to A but won against C and F.
- E lost to B but won against C and F.
- B lost at least one match.
- F did not play against the top team of Stage-I.
Stage-II:
- The leader of Stage-I lost the next two matches.
- Of the two teams at the bottom after Stage-I, one team won both matches, while the other lost both matches.
- One more team lost both matches in Stage-II.
Q1: The two teams that defeated the leader of Stage-I are:
(1) F & D
(2) E & F
(3) B & D
(4) E & D
(5) F & D
Q2: The only team(s) that won both matches in Stage-II is (are)
(1) B
(2) E & F
(3) A, E & F
(4) B, E & F
(5) B & F
Q3: The teams that won exactly two matches in the event are:
(1) A, D & F
(2) D & E
(3) E & F
(4) D, E & F
(5) D & F
Q4: The team(s) with the most wins in the event is (are):
(1) A
(2) A & C
(3) F
(4) E
(5) B & E
Now let us devise a step-wise solution to above question. First, we will note down all key points given in the question.
- There are 6 teams: A, B, C, D, E and F.
- There are 3 matches in stage 1 and 2 matches in stage 2.
- Each team plays against other once only.
- There are no ties in the game.
Keeping these points in mind and using the information given about stage 1 we will construct a table for it.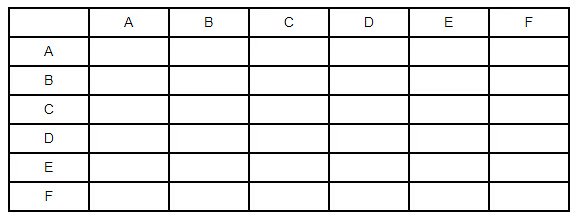
One by one we will interpret all the points given in stage 1 and use x to denote no match between two teams and won & loss for signifying winning and losing teams. The first statement is
- One team won all 3 matches. But at this moment we have no other information about which team has lost or won so we will get back to this point later.
- Two teams lost all matches. Though it is a useful piece of information as out of 6 teams 2 lost all but we have no further info about which team hence we will move on.
- Next is D lost to A. Thus, we will write lost in row 5 and column 1. Also, we will rule out D as the team who won all matches. Also, it won against C and F.
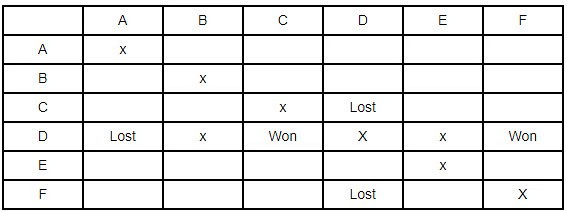
- Since no team can play against each other. Therefore, we have put x there. Also as all teams play only 3 matches. There will be no match between D & B and D & E.
- Again, as given E lost to B but won against C & F. Therefore, E is also ruled out of the one who won all matches or lost all matches. Thus, there would be no match of E & A and E & D.

- Given B has lost at least one match. Therefore, B is not all winning team. And B will not be the losing team too. Since, all B, C, D, E, and F has lost one match at least thus, A is the only team left and hence became the all winning team.
- F doesn’t play against the winning team i.e. A.
- Thus, C and F becomes all losing team. And this will be the table formed.

Now we will move on to stage 2 and move on to form a table.
- Given leader in stage 1 lost 2 matches. Since A is the leader. A will be the one who will have lost all matches in next stage. Also, each team has a just single match against the other, therefore, A will lose against E and F.

- Now out of the two, losing team one won next two matches and one lost all. Since F won against A. Therefore, F will be the winning team and C, the losing team.
- Also given another team lost both matches and it can’t be E, again as it won against A and it can neither be B as C to lose both matches require B to win against him. Therefore, D lost both too.

Now we are in position to answer any question regarding this problem. Hence, we can simply look at these tables and answer the above question easily. Using similar approach, we can solve many such Caselet reasoning questions.
2. Paragraph based on Numerical Data
To explain these type of Caselet once more we will make use of an example. Consider this problem.
Two traders, Chetan and Michael, were involved in the buying and selling of MCS shares over five trading days. At the beginning of the first day, the MCS share was priced at ₹100, while at the end of the fifth day it was priced at ₹110. At the end of each day, the MCS share price either went up by ₹10, or else, it came down by ₹10. Both Chetan and Michael took buying and selling decisions at the end of each trading day. The beginning price of MCS share on a given day was the same as the ending price of the previous day. Chetan and Michael started with the same number of shares and amount of cash, and had enough of both. Below are some additional facts about how Chetan and Michael traded over the five trading days.
- Each day if the price went up, Chetan sold 10 shares of MCS at the closing price. On the other hand, each day if the price went down, he bought 10 shares at the closing price.
- If on any day, the closing price was above ₹110, then Michael sold 10 shares of MCS, while if i was below ₹90, he bought 10 shares, all at the closing price.
Q1: If Chetan sold 10 shares of MCS on three consecutive days, while Michael sold 10 shares only once during the five days, what was the price of MCS at the end of day 3?
(1) ₹ 90
(2) ₹100
(3) ₹110
(4) ₹120
(5) ₹130
Q2: If Chetan ended up with ₹1300 more cash than Michael at the end of day 5, what was the price of MCS share at the end of day 4?
(1) ₹90
(2) ₹100
(3) ₹110
(4) ₹120
(5) Not uniquely determinable
Q3. If Michael ended up with 20 more shares than Chetan at the end of day 5, what was the price of the share at the end of day 3?
(1)₹90
(2) ₹100
(3) ₹110
(4) ₹120
(5) ₹130
Q4. If Michael ended up with ₹100 less cash than Chetan at the end of day 5, what was the difference in the number of shares possessed by Michael and Chetan (at the end of day 5)?
(1)Michael had 10 less shares than Chetan.
(2) Michael had 10 more shares than Chetan.
(3) Chetan had 10 more shares than Michael,
(4) Chetan had 20 more shares than Michael.
(5) Both had the same number of shares.
To solve the above caselet and questions on them we will keep all the above-mentioned points and proceed similarly as in the previous example. Again, this time we will construct a table using significant key points
- In this case, there are two people Michael and Chetan.
- The price at the beginning of the first day is ₹100 and end of the fifth day is ₹110.
- Prices fluctuate every day either they went up by ₹10 or get down by ₹10. And the ending price of that day becomes the beginning price of next day.
- Using the above points there could be drawn 10 different cases and a table can be constructed like this:
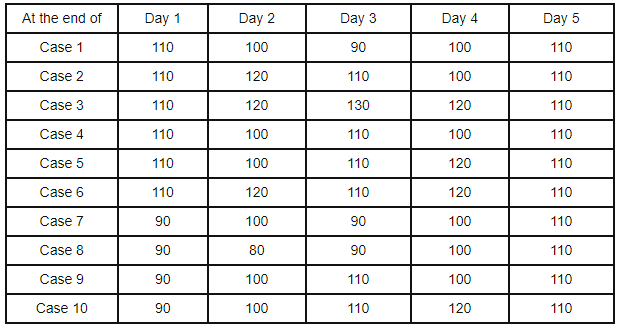
Now with help of two points given in problem about Michael and Chetan and their reaction to decrease and increase in prices. We will directly solve all the following questions of the problem.
Data Sufficiency
For solving data sufficiency questions you need to first understand the question and based on that, selection should be made. The questions will be asked with certain information with two statements labelled I and II. You need to analyze whether the information given in the label I and II is adequate to come to the solution or not. You should use all the data given in the statements along with your mathematics skills and well-known facts (such as sun rises in the east or the meaning of niece), the selection is to be made from the below given options:
The answer can be obtained from Statement I alone but Statement II alone is not sufficient to answer the question asked;
A. Data in statement 1 is sufficient alone to determine the answer.
B. Data in statement 2 is sufficient alone to determine the answer.
C. Data in either of the statements is sufficient to determine the answer.
D. Data provided in both the statements together are not sufficient to determine the answer.
E. Data in both statements are required to determine the answer.
Note: In data sufficiency problems, you can mark as “the data given in the statements is satisfactory” only when there is outcome or solution is in the numerical value.
Q: A group of boys is practising football in a rectangular ground. Raju and Ratan are standing at the two opposite mid-points of the two shorter sides. Raju has the ball, who passes it to Rivu, who is standing somewhere on one of the longer sides. Rivu holds the ball for 3 seconds and passes it to Ratan. Ratan holds the ball for 2 seconds and passes it back to Raju. The path of the ball from Raju to Rivu makes a right angle with the path of the ball from Rivu to Ratan. The speed of the ball, whenever passed, is always 10 metre per second, and the ball always moves on straight lines along the ground.Consider the following two additional pieces of information:
I. The dimension of the ground is 80 metres × 50 metres.
II. The area of the triangle formed by Raju, Rivu and Ratan is 1000 square metres.Consider the problem of computing the following: how many seconds does it take for Raju to get the ball back since he passed it to Rivu?
(a)I alone is sufficient to solve the problem.
(b)II alone is sufficient to solve the problem.
(c)Either of I or II, by itself, is sufficient to solve the problem.
(d)I and II both are required to solve the problem.
(e)The problem cannot be solved even with both I and II.
Answer: Option A
Sol: The given problem involves understanding the movement of a football being passed between players on a rectangular ground. Let's break down the information provided:
Raju and Ratan stand at opposite mid-points of the shorter sides of the ground.
Raju passes the ball to Rivu, who is somewhere on one of the longer sides.
Rivu holds the ball for 3 seconds and passes it to Ratan, forming a right angle with the previous pass.
Ratan holds the ball for 2 seconds and passes it back to Raju.
We are given two additional pieces of information:
I. The dimensions of the ground are 80 meters × 50 meters.
II. The area of the triangle formed by Raju, Rivu, and Ratan is 1000 square meters.
Now, we need to find out how many seconds it takes for Raju to get the ball back since he passed it to Rivu.
Let's analyze each piece of information:
I. The dimension of the ground provides us with the length and width of the rectangle where the boys are playing football. This information alone doesn't directly help us find the time taken for Raju to get the ball back.
II. The area of the triangle formed by Raju, Rivu, and Ratan is given. This information, along with the fact that Rivu and Ratan are standing at the mid-points of the shorter sides, allows us to determine the lengths of the sides of the triangle formed by the players. With this triangle's area, we can use the formula for the area of a triangle (area = 1/2 * base * height) to find the height of the triangle. Since the base is the length of the ground (80 meters), the height of the triangle gives us the distance from Rivu to the midpoint of the longer side. This distance is also the length of the path the ball traveled from Raju to Rivu. We can use this distance, along with the speed of the ball (10 meters per second), to find the time taken for the ball to reach Rivu. Therefore, statement II alone is sufficient to solve the problem.
Hence, the correct answer is option (a) I alone is sufficient to solve the problem.
Clock and Calendars
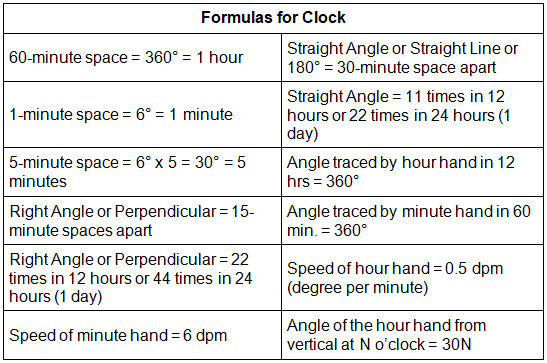
Formulas for Calendar
- 1 ordinary year = 365 days = (52 weeks + 1 day.)
- 1 ordinary year has 1 odd day. 1 leap year has 2 odd days. = (76 x 1 + 24 x 2) odd days = 124 odd days.

~ 100 years give us 5 odd days as calculated above.
~ 200 years give us 5 x 2 = 10 – 7 (one week) 3 odd days.
~ 300 years give us 5 x 3 = 15 – 14 (two weeks) 1 odd day.
~ 400 years give us {5 x 4 + 1 (leap century)} – 21} (three weeks) 0 odd days.
~ Month of January gives us 31 – 28 = 3 odd days.
~ Month of February gives us 28 – 28 = 0 odd day in a normal year and 1 odd day in a leap year and so on for all the other months.
Q: What is the angle between the minute hand the hour hand when the time is 4:30.
A. 350
B. 100
C. 200
D. None of the above
Ans: Option A
Solution:
Tip: It is easy to calculate the angle between the minute and the hour hand by using a simple formula,
Angle = (X*30)-((Y*11)/2)
Multiplying hours with minutes, we get = 4 x 30 = 120
Applying the formula, we get (Yx11)/2
= 30 x 11/ 2
= 165
When we subtract the two values, we get,
= 165 – 130
= 350
Puzzles
Some basic processes to solve puzzle questions are mentioned below.

Read the Question Multiple TImes
- Go through the question and the statement carefully. It will help to build up an overall idea. Statement is one of the most important parts of a question. So, each instruction must be followed.
Solve by Diagrams
- Practise making Diagrams whenever possible. Diagrams represent the information in a more logical and efficient way. Some problems, such as seating arrangement, cannot be solved without the help of diagrams, while for some - Cubes, Grid Puzzles- they are optional.
Infer from Diagrams
- Conversely, If the Question involves a diagram, before marking the answer, write down all the important points displayed in the diagram. It helps to analyse the given data.
Always Make Cases
- Do not assume. Instead make cases for each possibility. Then, review the data carefully and eliminate cases.
Q: Faculty members in a management school can belong to one of four departments - Finance and Accounting (F&A), Marketing and Strategy (M&S), Operations and Quants (O&Q) and Behaviour and Human Resources (B&H). The numbers of faculty members in F&A, M&S, O&Q and B&H departments are 9, 7, 5 and 3 respectively.
Prof. Pakrasi, Prof. Qureshi, Prof. Ramaswamy and Prof. Samuel are four members of the school's faculty who were candidates for the post of the Dean of the school. Only one of the candidates was from O&Q.
Every faculty member, including the four candidates, voted for the post. In each department, all the faculty members who were not candidates voted for the same candidate. The rules for the election are listed below.
1. There cannot be more than two candidates from a single department.
2. A candidate cannot vote for himself/herself.
3. Faculty members cannot vote for a candidate from their own department.
After the election, it was observed that Prof. Pakrasi received 3 votes, Prof. Qureshi received 14 votes, Prof. Ramaswamy received 6 votes and Prof. Samuel received 1 vote. Prof. Pakrasi voted for Prof. Ramaswamy, Prof. Qureshi for Prof. Samuel, Prof. Ramaswamy for Prof. Qureshi and Prof. Samuel for Prof. Pakrasi.
Which two candidates can belong to the same department?
A: Prof. Pakrasi and Prof. Qureshi
B: Prof. Pakrasi and Prof. Samuel
C: Prof. Qureshi and Prof. Ramaswamy
D: Prof. Ramaswamy and Prof. Samuel
Sol: Now, we know there is only 1 candidate from OQ, which means that the number of non-candidate voters in OQ will be 4.
We also know that the non-candidates in a particular department voted as a block, and we also know that the least number of non-candidate voters in a particular department can be 1 (BH, 3-2 faculty).
Now, we also know that R got 5 votes from non-candidates.
Now we can write 5 as
i)5
ii)4+1
iii)3+2
Considering case (i) 4+1. This is only possible when there is 1 candidate from OQ, and there are 2 candidates from BH. This implies that the number of candidates in FA and MQ is 1. Now, if we consider FA and MQ and put only 1 candidate there, it implies that there are 15 non-candidate voters between them. Now we know this is not possible since the maximum number of non-candidate voters a candidate can get is 13. (Please note that non-candidates of a particular department vote as a block).
On similar grounds, we can eliminate Case (iii) as it also implies there is only 1 candidate in FA and MQ.
Now, considering Case (i), we know that 5+0 will happen only one when there are 5 non-candidates in a single department. This is only possible in MS (Out of 7, there will be 2 candidates and 5 non-candidates).
So we can conclude that MS has 2 candidates and that they voted Prof. R…….(I)
We also know that Prof P got 2 votes from Non-candidates. This is only possible when BH has 1 candidate.
So, we can conclude that the number of professors in FA, MS, OQ, BH is 0,2,1,1


Now, if we consider Department MS, we know that there are 2 candidates from MS and R can’t be one of them as the people in that department voted for him….. (3rd condition).
So the possible combinations of candidates in MS are (P,Q), (Q,S), (P,S).
Now we also know that no one can vote for a candidate in their own department, so we can eliminate (P,S) and (Q,S) as we know that S voted for P and Q voted for S).
So we can infer that P and Q are from MS.

Now, among the given options, Only Option A is true. Therefore, Option A is the correct answer.
How to Prepare for CAT DILR?
- Do not presume or use any information which is not provided to you by the question. This is not an assessment of how much you generally know about a topic. Consider only the information given when choosing among the alternative answers to each reading passage.
- Carefully read the factual passage and the instruction for sentence completion. Both have to be taken into account when making your choice.
- Be sure to carefully read all answer options before eliminating or choosing one of them.
- In questions that ask you to choose a valid conclusion, always choose the one conclusion that certainly follows from the information given to you. In questions that ask you to find the incorrect alternative, select the one conclusion that definitely does not fit the Information given to you.

- Focus on practicing as much as you can: The questions in DILR are based on data in tables, charts, graphs, diagrams, case studies, logical games, calendars, clocks, cubes, seating arrangements, blood relations, etc. Hence to be able to solve these questions on time and accurately, candidates have to practice as many questions as possible in the last few days. Mock test and previous year paper are the best resource to do so.
- Practice time management: This year the candidates shall get 40 mins per section. Hence the candidates have to ensure that they are not spending a lot of time in one particular questions, but their time is equally divided among all the 3 sections. The best is to practice the DILR questions in a manner that all the questions are completed within 40 mins and with 100% accuracy.
- Do not start any new topic in DILR now: Suppose a candidate has not yet practice the pie chart type question, then it is advised to just have a look at those type of questions. Do not start the topic from the scratch as this will only lead to confusion in concepts. Since CAT has negative marking, it is always better to focus on the strengths and get as many correct answers as possible.
- Question selection: In the last week is for strategising, the candidates must figure out what type of questions they are most comfortable to solve. These questions must be solved first on the exam day. This will enable the candidates to stay high on confidence while solving the problems and will save time as well.
- Accuracy is important: The candidates have to focus on getting a question accurate in one go. The level of practice must be such that the candidates can solve the question and get the correct answer in one go.
- Practice to scan the questions: Most of the answers in the DILR section is hidden in the question itself. Hence, candidates need a sharp eye, out of box thinking, and ability to read between the lines. This can come from regular practice, try to understand the questions and read it more than once.
|
72 videos|112 docs|113 tests
|
FAQs on Final Revision: Logical Reasoning & Data Interpretation For CAT - Reasoning Aptitude for Competitive Examinations - Bank Exams
| 1. What are the key topics covered in Logical Reasoning & Data Interpretation for the CAT exam? |  |
| 2. How should I approach studying Logical Reasoning & Data Interpretation for the CAT exam? |  |
| 3. What are some common question types that I can expect in the Logical Reasoning & Data Interpretation section of the CAT exam? |  |
| 4. How can I improve my speed and accuracy in solving Logical Reasoning & Data Interpretation questions for the CAT exam? |  |
| 5. Are there any specific strategies or tips for tackling the Logical Reasoning & Data Interpretation section of the CAT exam? |  |


