Overview: Venn Diagram | General Intelligence and Reasoning for SSC CGL PDF Download
| Table of contents |
|
| Venn Diagram |
|
| What is Venn Diagram? |
|
| Example of Venn Diagram |
|
| Terms Related to Venn Diagram |
|
| Venn Diagram for Sets Operations |
|
| Venn Diagram Formula |
|
| Solved Examples on Venn Diagram |
|

Venn Diagram
Math is a subject where data plays a very important role and representing data in the easiest format is also very important. The ways to represent data in order to make it easy to understand are graphs, charts, and diagrams. They not only make the Data look neat but also make it very easy to remember and understand properly, one of those ways is to represent the data through Venn Diagram.
What is Venn Diagram?
Venn Diagrams serve as a visual tool to depict data groups using circles. When the circles overlap, it indicates shared elements between the data groups; when they don't overlap, there are no common elements. These sets are depicted as circles contained within a rectangular frame representing the Universal set. The Universal set encompasses all circles, signifying that it comprises all elements encompassing all the data sets.
John Venn, a famous logician gave the concept of diagrams in 1918, this is why the diagrams are named Venn diagrams. There are several benefits of Venn Diagrams,
- Venn diagram is used for the classification of data belonging to the same category but different sub-categories.
- The comparison of the different data becomes easier through the Venn diagram, also the relationship between the data.
- Grouping the information and finding similarities and differences among them becomes easy.
- The different unknown parameters can be easily understood and found with the help of Venn diagrams.
Example of Venn Diagram
Venn diagrams are highly useful in solving problems of sets and other problems. Venn diagrams are useful in representing the data in picture form. Let’s learn more about the Venn diagram through an example,
Example: Take a set A representing even numbers up to 10 and another set B representing natural numbers less than 5 then their interaction is represented using the Venn diagram.
Solution: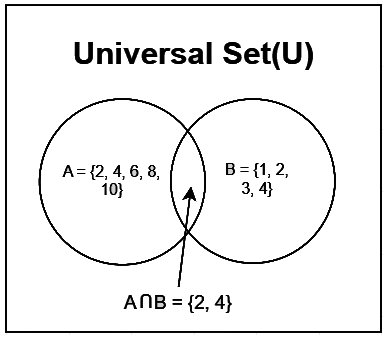
Terms Related to Venn Diagram
The concept of the Venn diagram is very useful for solving a variety of problems in Mathematics and others. To understand more about it let’s learn some important terms related to it.
Universal Set
Universal Set is a large set that contains all the sets which we are considering in a particular situation.
For example, suppose we are considering the set of Honda cars in a society say set A, and let set B is the group of Red car in the same society then the set of all the cars in that society is the universal set as it contains the values of both the sets, set A and set B in consideration.
The image representing the Universal set is discussed below,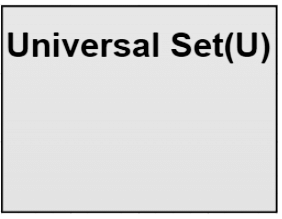
Subset
Subset is actually a set of values that is contained inside another set i.e. we can say that set B is the subset of set A if all the values of set B are contained in set A.
For example, if we take N as the set of all the natural numbers and W as the set of all whole numbers then,
N = Set of all Natural Numbers
W = set of all Whole Numbers
we can say that N is a subset of W as all the values of set N are contained in set W.
We represent the subset using the ⊆ symbol. In the above example, we write,
N ⊆ W
It is read as N is a subset of W.
We use Venn diagrams to easily represent a subset of a set. The images discussing the subset of a set are given below,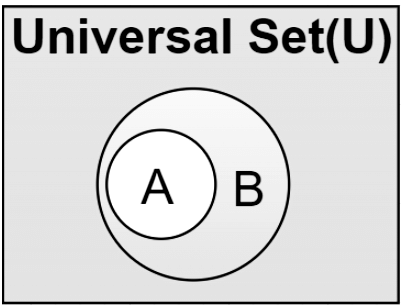
Venn Diagram Symbols
In order to draw a Venn diagram, first, understand the type of symbols used in sets. Sets can be easily represented on the Venn diagram and the parameters are easily taken out from the diagram itself. We use various types of symbols in drawing Venn diagrams, some of the most important types of symbols used in drawing Venn diagrams are,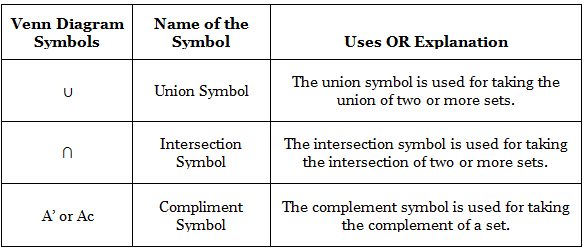
How to Draw a Venn Diagram?
The above symbols are used while drawing and showing the relationship among sets. In order to draw a Venn diagram.
Step 1: Start by drawing a Rectangle showing the Universal Set.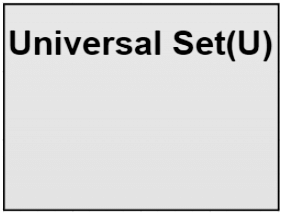
Step 2: According to the number of sets given and the relationship between/among them, draw different circles representing different Sets.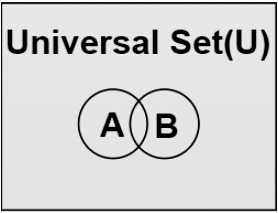 Step 3: Find the intersection or union of the set using the condition given.
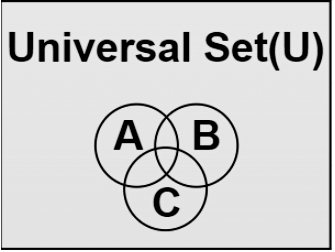
Venn Diagram for Sets Operations
There are different operations that can be done on sets in order to find the possible unknown parameter, for example, if two sets have something in common, their intersection is possible. The basic operations performed on the set are,
- Union of Set
- Intersection of Set
- Complement of Set
- Difference of Set
Let’s look at these set operations and how they look on the Venn diagram.
Union of sets Venn Diagram
The Union of two or more two sets represents the data of the sets without repeating the same data more than once, it is shown with the symbol ⇢∪.
n(A∪ B) = {a: a∈ A OR a∈ B}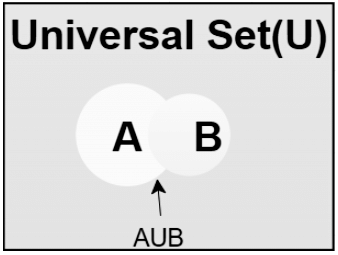
Properties of Union of a set
Various properties of the Union of a set are,
- A∪ B = B∪ A ⇢ [Commutative property]
- A∪ (B ∪ C) = (A∪ B) ∪ C ⇢ [Associative property]
- A ∪ U = U
- A ∪ A’ = U
- A ∪ A = A
Intersection of sets Venn Diagram
The intersection of two or more two sets means extracting only the amount of data that is common between/among the sets. The symbol used for the intersection⇢ ∩.
n(A∩ B)= {a: a∈ A and a∈ B}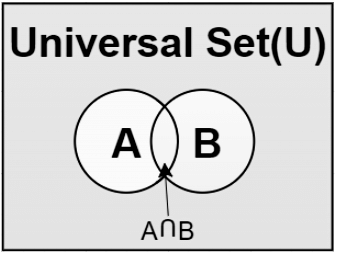
Properties of Intersection of Set
Various properties of the Intersection of a set are,
- A ∩ B= B ∩ A ⇢ [Commutative property]
- (A ∩ B) ∩ C= A ∩ (B ∩ C) ⇢ [Associative property]
- A ∩ A= A
- A ∩ U= A
- A ∩ A’= φ
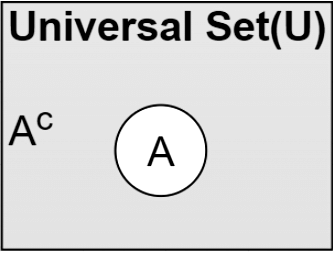
Complement of a set of Venn Diagram
Complementing a set means finding the value of the data present in the Universal set other than the data of the set.
n(A’) = U- n(A)
Difference of Set Venn Diagram
Suppose we take two sets, Set A and Set B then their difference is given as A – B. This difference represents all the values of set A which are not present in set B.
For example, if we take Set A = {1, 2, 3, 4, 5, 6} and set B = {2, 4, 6, 8} then A- B = {1, 3, 5}.
In the Venn diagram, we represent the A – B as the area of set A which is not intersecting with set B.
Types of Venn Diagrams
There are various types of Venn diagrams that are widely used in Mathematics and other related fields. The various types of Venn diagrams are categorized based on the number of sets involved or circles involved in the Universal set.
- Two-set Venn diagram
- Three-set Venn diagram
- Four-set Venn diagram
- Five-set Venn diagram
Venn Diagram for Three Sets
We can represent three sets easily using the Venn Diagram. Their representation is done by three overlapping circles. Suppose we take three sets of Set A of the people who play cricket. Set B of the people who are graduates and Set C of the people who are 18 years and above of the age.
Then the Venn diagram representing the above three sets is drawn using three circles and taking their intersection wherever required.
Representation of a Three-Set Venn diagram
We can represent the intersection of three sets using the Venn diagram. The below image represents the intersection of three sets.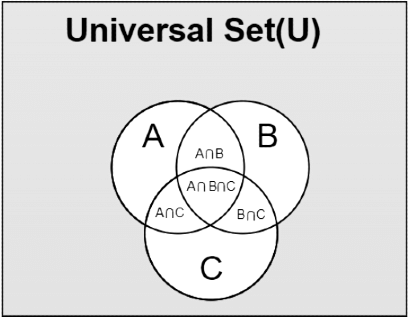
We can find the various parameters using the above Venn diagram.
Suppose we have to find,
- No of graduates who play cricket it is given by B⋂C
- No of graduates who play cricket and are at least 18 years old is given by A⋂B⋂C, etc.
Venn Diagram Formula
We use various formulas of the set to find various parameters of the sets.
Let’s take two sets, set A and set B then the various formulas of the sets are,
n(A U B) = n(A) + n(B) – n (A ⋂ B)
where,
n(A) represents the number of elements in set A
n(B) represents the number of elements in set B
n(A U B) represent the number of elements in A U B
n(A ⋂ B) represent the number of elements in A ⋂ B
Similarly, for three sets, Set A, Set B, and Set C we get,
- n (A U B U C) = n(A) + n(B) + n(C) – n(A ⋂ B) – n(B ⋂ C) – n(C ⋂ A) + n(A ⋂ B ⋂ C)
We can understand these formulas with the help of the example discussed below,
Example: In a class of 40 students, 18 like Mathematics, 16 like Science, and 10 like both Mathematics and Science. Then find the students who like either Mathematics or Science.
Solution: Let A be the set of students who like Mathematics and B be the set of students who like Science, then
n(A) = 18
n(B) = 16
n(A ⋂ B) = 10
Now to find the number of students who like either Mathematics or Science i.e. n(A U B) we use the above formula.
n(A U B) = n(A) + n(B) – n (A ⋂ B)
n(A U B) = 18 + 16 – 10
= 24
Applications of Venn Diagram
Venn diagrams have various applications they are highly used in solving various problems and representing the data in an easy-to-understand format. We use Venn diagrams in various fields such as Mathematics, Logic and Computing, Education, Business Analysis, etc.
Various uses of the Venn diagrams are,
- The relation between various sets and their operations can be easily achieved using Venn diagrams.
- Venn diagrams are used for explaining large data sets in a very easy way.
- Venn diagrams are used for logic building and finding the solution to complex data problems.
- Venn diagrams are used to solve problems based on various analogies.
- Analysts use Venn diagrams to represent complex data in easily understandable ways, etc.
Solved Examples on Venn Diagram
Example 1: Set A= {1, 2, 3, 4, 5} and U= {1, 2, 3, 4, 5, 6, 7, 8, 9, 10}.
Represent A’ or Ac on the Venn diagram.
Solution: Venn Diagram for A’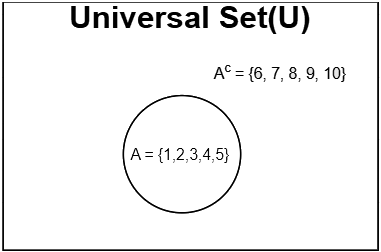
Example 2: In a Group of people, 50 people either speak Hindi or English, 10 prefer speaking both Hindi and English, 20 prefer only English. How many people prefer speaking Hindi? Explain both by formula and by Venn diagram.
Solution: According to formula,
n(H∪E) = n(H) + n(E) – n(H∩E)
Both English and Hindi speakers, n(H∩E) = 10
English speakers, n(E)= 20
Either Hindi or English, n(H∪E)= 50
50= 20+ n(H) – 10
n(H)= 50 – 10
n(H)= 40
From Venn Diagram,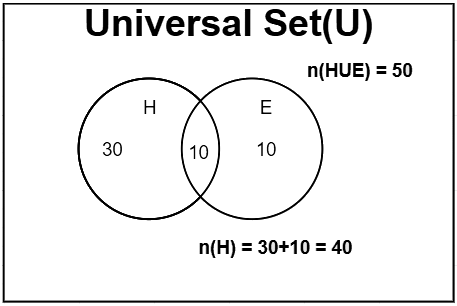
|
175 videos|211 docs|199 tests
|
FAQs on Overview: Venn Diagram - General Intelligence and Reasoning for SSC CGL
| 1. What is a Venn diagram? |  |
| 2. How are Venn diagrams useful in set operations? | |
| 3. How do you represent the union of two sets in a Venn diagram? | |
| 4. Can Venn diagrams be used for more than two sets? | |
| 5. How do Venn diagrams help in solving set-related problems? | |


Overview: Venn Diagram | General Intelligence and Reasoning for SSC CGL
,mock tests for examination
,Important questions
,Exam
,Semester Notes
,ppt
,Free
,Overview: Venn Diagram | General Intelligence and Reasoning for SSC CGL
,Summary
,Overview: Venn Diagram | General Intelligence and Reasoning for SSC CGL
,past year papers
,Viva Questions
,study material
,MCQs
,Extra Questions
,Objective type Questions
,Sample Paper
,Previous Year Questions with Solutions
,video lectures
,practice quizzes
,shortcuts and tricks
;


Overview: Venn Diagram Free PDF Download
Importance of Overview: Venn Diagram
Overview: Venn Diagram Notes
Overview: Venn Diagram SSC CGL Questions
Study Overview: Venn Diagram on the App
|
© EduRev
|
Education Revolution
|


|


