Tips and Tricks for Line Graphs

What is a Line Graph?
A line graph, often referred to as a line chart, is a fundamental graphical representation used to illustrate a dataset visually. In line graphs, a straight line segment connects data points, also known as markers, to depict a continuous change over a specified time frame. As these data points convey the information, line graphs are alternatively labeled as point-to-point graphs.
Line graphs are particularly effective in showcasing continuous changes, making them valuable for comparing variations over the same time duration across multiple groups. Typically, independent data (or variables) are plotted along the horizontal axis, while dependent variables are depicted along the vertical axis. An example will provide further clarity on this concept.
Example: The birth and death rates of a particular city are given below. Study the chart carefully and answer the given questions.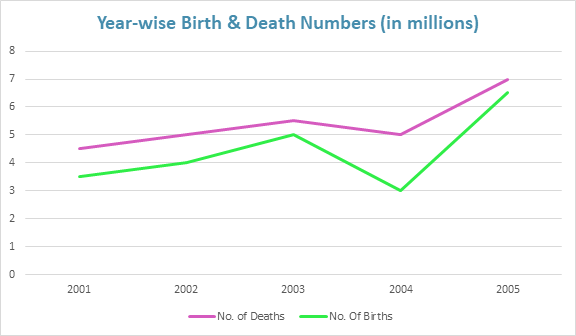
Q1: Calculate the average number of births in the city between 2001 to 2005.
(a) 3.2 billion
(b) 2.8 million
(c) 4.4 million
(d) 4 million
Ans: (c)
Sol:
From the graph, calculate the values of total births between 2001 to 2005. Then find the average of them.
So, average births = (3.5 + 4 + 5 + 3 + 6.5)/ 5 = 4.4.
Therefore, the average births between 2001 to 2005 is 4.4 million (since units are in millions).
Hence, option (c) is the answer.
Q2: By what percent (approx.) did the number of births increase in 2005 from the previous year?
(a) 180
(b) 150
(c) 90
(d) 117
Ans: (d)
Sol: At first, the increase in births has to be calculated.
So, Increase in deaths in 2005 from 2004 = 6.5 - 3 = 3.5 million.
Now, percentage increase = (3.5 / 3) × 100 = 116.66 %.
As the closest option is 117 %, the answer will be option (d).
Q3: Calculate the difference between the number of deaths and the number of births over the years.
(a) 5 million
(b) 6 million
(c) 1 billion
(d) 3 million
Ans: (a)
Sol: First, the total deaths and births over the years have to be calculated.
So, total deaths over the years = 27 and,
Total births over the years = 22
Now, the difference will be = 27 - 22 = 5.
Hence, the correct answer will be an option (a) i.e. 5 million.
Q4: In which year was the percentage increase in birth rate over the previous year the maximum?
(a) 2001
(b) 2002
(c) 2003
(d) 2005
Ans: (d)
Sol: Calculate the percentage increase in each year or approximate to find the maximum.
General Approach: To compute the annual percentage increase, one can apply the following formula:
For a given year, the percentage increase or decrease is calculated as (the difference of values from the previous year / the value in that year) × 100.
For 2002, the percentage increase is  Likewise, for 2003, the percentage increase is 25%.
For 2004, the percentage increase is -40% (decrease).
And for 2005, the percentage increase is nearly 116.7%.
Observing that the highest percentage increase occurred in 2005, option (d) stands as the correct answer.
Tips to Solve CAT Line Graph Questions
Line graph topics should not be overlooked, as many questions in this category are both manageable and high-scoring. The following essential tips aim to assist individuals in preparing for and tackling line graph questions with ease and efficiency.
Foundation in Basic Mathematics: To successfully solve CAT line graph questions, a solid grasp of fundamental mathematical concepts like percentages, profit and loss, is essential. Prior familiarity with these basic concepts and related formulas instills confidence, enabling the application of shortcuts during CAT exams.
Regular Practice: Proficiency in solving line graph questions is developed through consistent and structured practice. Working through various line graph question variations, solving previous years' questions, and taking mock tests are crucial for becoming adept at handling diverse problems in this category.
Approximations and Shortcuts: Employing approximations in certain scenarios significantly accelerates problem-solving. Many questions can be efficiently tackled by approximating values and selecting the nearest option. The strategic use of shortcuts further contributes to swift and effective problem-solving.
Focus on Graph Details: Careful analysis of the graph, particularly its slope, often leads to straightforward problem-solving. This approach aids in understanding the trend of the graph at specific points, facilitating the easy resolution of questions related to CAT line graphs.
FAQs on Tips and Tricks for Line Graphs
| 1. What is a line graph and when is it typically used? |  |
| 2. What are the key components of a line graph? | |
| 3. How can one effectively interpret a line graph? | |
| 4. What are some common mistakes to avoid when creating a line graph? | |
| 5. What tips can help in solving line graph questions in exams? | |


