Important Formula: Pie Charts | Quantitative Aptitude for SSC CGL PDF Download
Formula
- Pie graphs are circular shaped graphs which are divided into sectors or slices to represent numerical data.
- In a pie chart, the length or central angle of each sector or slice is proportional to the quantity it represents.

Pie Chart Formulas in DI
- A pie chart is a form of graphical representation that segments a circle into sectors, each depicting numeric values. Each sector corresponds proportionally to a part of the complete circle, and the entire data set within the pie totals 360°, with the complete pie always adding up to 100%.
- There are two primary formulas employed in pie charts:
- To ascertain the percentage of a given data point, utilize the formula: (Frequency ÷ Total Frequency) × 100.
- For the conversion of data into degrees, apply the formula: (Given Data ÷ Total value of Data) × 360°.
Uses of Pie Chart In Data Interpretation
The primary purpose of a pie chart is to facilitate comparisons. When items are depicted on a pie chart, it becomes simple to discern the most and least popular items.
Pie charts find diverse applications in business, education, and domestic settings. In the business realm, they prove useful for illustrating the performance of specific products or services, indicating success or failure. Additionally, they can effectively portray a business's market reach in comparison to similar enterprises.
Note: While pie charts are popular data representations, they can be hard to read, and it can be difficult to compare data from one pie chart to another.
Examples
Example 1: Directions: The following pie-chart shows the market share of different banks in India. Based on this pie-chart determine the questions given below.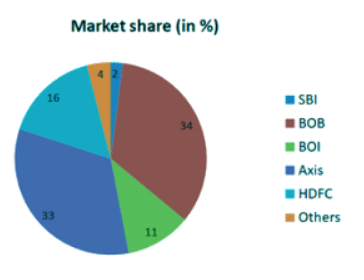
Find the approximate ratio of market share between BOI and BOB.
(a) 1 : 2
(b) 3 : 1
(c) 1 : 3
(d) Not possible
Ans: (c)
Take the market share of BOB and BOI and compare them both to find the ratio. As a result, the market share of BOB is given as 34 % and the market share of BOI is given as 11 %. So, the ratio of market share of BOI to a market share of BOB will be 11 : 34. This will be close to 1 : 3. So, the correct answer is C.
Example 2: Directions: The following pie-chart shows the market share of different banks in India. Based on this pie-chart determine the questions given below.
If the total market share other than Axis and BOB is Rs. 335,000 crores. Then find the market share of BOI and HDFC banks.
(a) 274,560 crores
(b) 274,090 crores
(c) 274,809 crores
(d) Cannot be determined
Ans: (c)
Here, from the pie-chart, you can determine that the total market share of Axis and BOB in terms of percentage is 67 % and this is equal to Rs. 335,000. In addition to this the other banks that are left accounts for 33 % which equates to 35,000 crores. HDFC and BOI equal the market share of 27 %. Thus, their market share in terms of crores is 27 x 335000/33 => 274090 crores. So, the correct answer is C.
Example 3: Directions: The following pie-chart shows the market share of different banks in India. Based on this pie-chart determine the questions given below.
If the value of the market share of BOI is Rs. 4000 crores, then the market share of BOB and Axis bank together is
(a) 24,363 crores
(b) 24,432 crores
(c) 24,864 crores
(d) 25, 827 crores
Ans: (a)
You can see that BOI accounts for 11 % of the market share. And this 11 % is equal to the 4000 crores. So to calculate the total market share of BOB and axis the formula will be, 67/11 x 4000 = 24,363. Thus, the correct answer is A.
Example 4: Directions: The pie chart given below shows the spending of Arvind Kejriwal’s family on different articles for the year 2011 according to data. Analyse the pie chart and answer the questions which follow.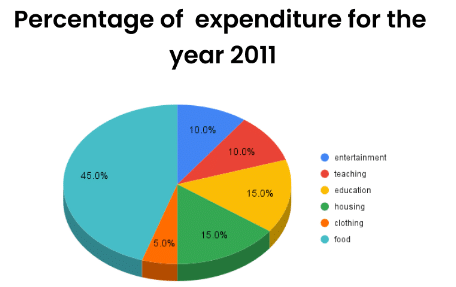
If the total amount that was spent in the year 2011 was 50000 by Kejriwal’s family, the amount that was spent on food was
(a) Rs.225000
(b) Rs.22500
(c) Rs.24000
(d) Rs.21400
Ans: (b)
Amount spent on Food = 45% of Rs. 50000/- = Rs. 22500/-
Example 5: Directions: The pie chart given below shows the spending of Arvind Kejriwal’s family on different articles for the year 2011 according to data. Analyse the pie chart and answer the questions which follow. If the total amount that was spent in the year 2011 was Rs. 48000 by Kejriwal’s family, the amount that was spent on housing and clothing combined was
(a) Rs.9600
(b) Rs.8000
(c) Rs.10000
(d) Rs.12000
Ans: (a)
Amount spent on Clothing and Housing together = (15% + 5% = 20%) of 48000 = Rs. 9600/-.
|
315 videos|182 docs|185 tests
|
FAQs on Important Formula: Pie Charts - Quantitative Aptitude for SSC CGL
| 1. What is a pie chart and how is it used? |  |
| 2. How do you calculate the angle of each slice in a pie chart? |  |
| 3. What are the advantages of using a pie chart? |  |
| 4. What are the limitations of a pie chart? |  |
| 5. How can I interpret a pie chart effectively? |  |


