Tips and Tricks: Bar Charts | Quantitative Aptitude for SSC CGL PDF Download

Definition
A bar chart, also referred to as a bar graph, visually depicts data by using rectangular bars or columns to illustrate and compare various categories or groups of information.
Tips and Tricks for Bar chart
- Prior to addressing any questions, it is essential to grasp the intended message conveyed by the bar graph. Develop the practice of initially scanning the heading for comprehension.
- Familiarize yourself with the content on the x-axis and y-axis, and establish an understanding of how the lengths of bars relate to each other.
- The resolution of these questions tends to be straightforward. Merely interpret the data mentally, taking note of the lengths of the bars, and the answers will naturally follow.
- Occasionally, solving the calculations for one question can contribute to resolving the calculations for another question.
Important points for Tips and Tricks of Bar chart
- Thoroughly read both the questions and instructions with precision.
- Employ approximation techniques when performing calculations.
- Conduct a thorough and efficient analysis of the provided data.
- Refrain from making assumptions beyond the scope of the given data.
- Skip unnecessary calculations to streamline the problem-solving process.
- Prioritize accuracy as the primary factor in resolving the questions.
- Establish a solid understanding of the fundamentals of Data Interpretation, focusing on concepts such as Averages, Percentage, and Ratio and Proportion.
Examples
Example 1: Production of paper (in lakh tonnes) by three companies X, Y and Z owned by Ratan Tata over the years is given below in a graph. Study the graph and answer the questions that follow.
In X- axis year is given and in Y- axis Quantity in Lakh Tones is given.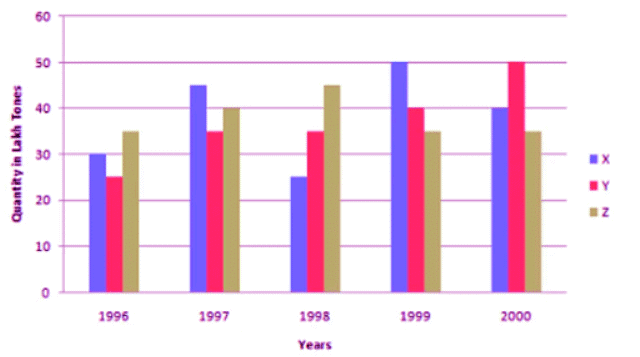
What is the percentage increase in the production of Company Y from 1996 to 1999?
(a) 30%
(b) 60%
(c) 50%
(d) 45%
Ans: (b)
Percentage increase in the production of Company Y from 1996 to 1999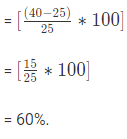
Example 2: Production of paper (in lakh tonnes) by three companies X, Y and Z owned by Ratan Tata over the years is given below in a graph. Study the graph and answer the questions that follow.
In X- axis year is given and in Y- axis Quantity in Lakh Tones is given.
Which company has the highest average production over a five-year period?
(a) X
(b) Y
(c) Z
(d) X and Z both
Ans: (d)
Average production (in lakh tons) in five years for the three companies are:
For Company X = [1/5 x (30 + 45 + 25 + 50 + 40) ] = 190/5 = 38.
For Company Y = [1/5 x (25 + 35 + 35 + 40 + 50) ] = 185/5 = 37.
For Company Z = [1/5 x (35 + 40 + 45 + 35 + 35) ] = 190/5 = 38.
Therefore, Average production of five years is maximum for both the Companies X and Z.
Example 3: Production of paper (in lakh tonnes) by three companies X, Y and Z owned by Ratan Tata over the years is given below in a graph. Study the graph and answer the questions that follow.
In X- axis year is given and in Y- axis Quantity in Lakh Tones is given.
In 1999 Production of Paper of X is What Percent of Production of Paper Y.
(a) 25 %
(b) 30 %
(c) 35 %
(d) None of these
Ans: (d)
In 1999 Production of Paper X = 50
In 1999 Production of Paper Y = 40
Required Percentage = 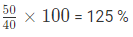
Example 4: Production of paper (in lakh tonnes) by three companies X, Y and Z owned by Ratan Tata over the years is given below in a graph. Study the graph and answer the questions that follow.
In X- axis year is given and in Y- axis Quantity in Lakh Tones is given.
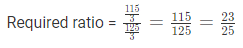
What is the ratio of the average production of company X in the period 1998-2000 to the average production of company Y in the same period?
(a) 1 : 1
(b) 15 : 17
(c) 23 : 25
(d) 27 : 29
Ans: (c)
Average production of company X in the period 1998-2000 =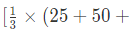
Average production of company Y in the period 1998-2000 
Example 5: Production of paper (in lakh tonnes) by three companies X, Y and Z owned by Ratan Tata over the years is given below in a graph. Study the graph and answer the questions that follow.
In X- axis year is given and in Y- axis Quantity in Lakh Tones is given.
What is the difference between the production of company Z in 1998 and company Y in 1996?
(a) 2,00,000 tons
(b) 20,00,000 tons
(c) 20,000 tons
(d) 2,00,00,000 tons
Ans: (b)
Required difference
= [(45 – 25) x 1,00,000] tons
= 20,00,000 tons.
|
342 videos|310 docs|185 tests
|


shortcuts and tricks
,practice quizzes
,past year papers
,Viva Questions
,mock tests for examination
,Summary
,Previous Year Questions with Solutions
,Tips and Tricks: Bar Charts | Quantitative Aptitude for SSC CGL
,MCQs
,Important questions
,ppt
,Tips and Tricks: Bar Charts | Quantitative Aptitude for SSC CGL
,Tips and Tricks: Bar Charts | Quantitative Aptitude for SSC CGL
,Exam
,Objective type Questions
,Extra Questions
,study material
,Free
,Semester Notes
,Sample Paper
,video lectures
;


Tips and Tricks: Bar Charts Free PDF Download
Importance of Tips and Tricks: Bar Charts
Tips and Tricks: Bar Charts Notes
Tips and Tricks: Bar Charts SSC CGL Questions
Study Tips and Tricks: Bar Charts on the App
|
© EduRev
|
Education Revolution
|


|


