12 Minute Test: Bar Graphs | Logical Reasoning (LR) and Data Interpretation (DI) - CAT PDF Download

Bar Graphs are a common and essential tool for presenting categorical data, and mastering them is key to excelling in this section. By practising with this focused test, you’ll sharpen your ability to interpret and analyse data from Bar Graphs, building the skills needed to tackle similar questions on the actual exam and boosting your confidence and performance.
Benchmarking Performance
This test contains two sets of Bar Graph questions, each of which you should aim to solve in 12 minutes.
If you solve within 12 minutes: You’re meeting the baseline for a top percentile. Now aim for 10-11 minutes per set to breach the 100-percentile barrier (solving 3+ sets in 40 minutes).
If you exceed 12 minutes: Focus on identifying gaps, such as misreading scales, confusing categories, or slow calculations.
Only after thorough self-effort should you review solutions to pinpoint what you missed, ensuring maximum learning and preparation for the CAT’s demanding DILR section. Good luck!
Set 1
Directions: Answer the questions based on the given information.
A management institute was established on 1st January, 2000, with 3, 4, 5 and 6 faculty members respectively in Marketing, Organisational Behaviour (OB), Finance, and Operations Management (OM) departments to start with. No faculty member retired or joined the institute in the first three months of the year 2000. In the next four years, the institute recruited one faculty member in each of the four departments. All these new faculty members, who joined the institute subsequently over the years, were 25 years old at the time of their joining the institute. All of them joined the institute on 1st April. During these four years, one of the faculty members retired at the age of 60. The following bar chart gives the department-wise average age (in terms of number of completed years) of faculty members as on April 1 of 2000, 2001, 2002 and 2003.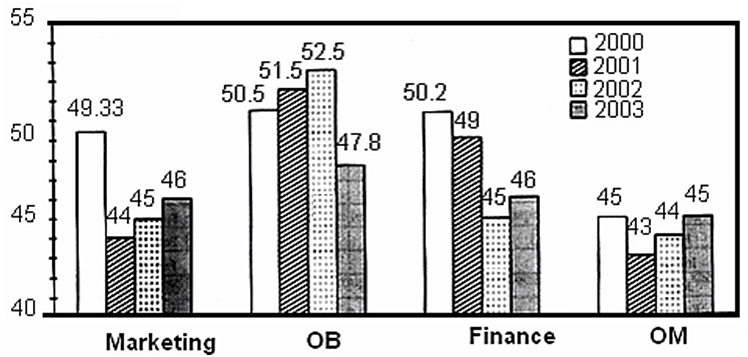
Q1: What was the age of the new faculty member who joined the OM department on 1st April, 2003?
(a) 25 years
(b) 26 years
(c) 27 years
(d) 28 years
Ans: c
Sol: As there is a dip in the average age in OM in 2001, and because of the fact that there is only 1 dip in the OM data set, in the OM department, a new person joined in 2001 at the age of 25 years.
Therefore, the age of the new faculty member who joined the OM department on 1st April, 2003, was 27 years.
Q2: Professors Naresh and Devesh, two faculty members of Marketing who have been with the institute since its inception, share their birthdays, which fall on 20th November. One was born in 1947 and the other in 1950. On 1st April, 2005, what was the approximate age of the third faculty member, who has been in the same area since inception?
(a) 47 years
(b) 50 years
(c) 51 years
(d) 52 years
Ans: d
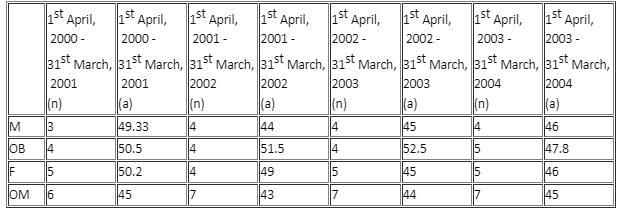
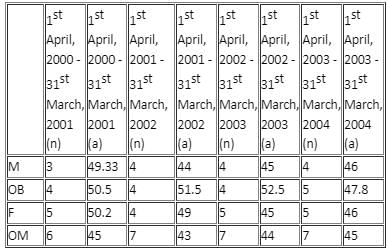
Sol: In the table, 'n' represents the number of faculty members in different areas and 'a' represents the average age of faculty members.
Sum of ages of Naresh and Devesh in 2000 = (52 + 49) years = 101 years
In 2000, age of the third faculty member = (49.33 × 3 - 101) years = 47 years
In 2005, age of the third faculty member = (47 + 5) years = 52 years
Q3: From which department did the faculty member retire?
(a) Finance
(b) Marketing
(c) OB
(d) OM
Ans: a
Sol: In the table, 'n' represents the number of faculty members in different departments and 'a' represents the average age of faculty members.
- It is given that 1 person was recruited in each of the departments. This is the key sentence.
- There is a dip in average age twice only in Finance. Whenever a person joins or leaves, the average age would be disturbed from its normal increasing value of 1 every year.
- Now, as 2 persons have not joined the same department, it must only be in Finance that a person retired in 1 year and another member joined in another year.
- Because of the fact that all departments have 1 dip in their average age, and Finance has 2, the possibility that the person who retired at 60 years of age and a new faculty member joined in the same department in the same year is ruled out.
- Furthermore, the normal trend in average age in each department is an increase of 1, which would be the normal behaviour if no person joins in or leaves, unless and until the average age of persons who leave and join in the same year is exactly the same.
Furthermore, as the trend is decrease in age and it is happening only once in each of the departments except Finance, the possibility that the average age would increase when a person joins is ruled out as only 1 person joins in the entire period in the data set.
Q4: In which year did the new faculty member join the Finance department?
(a) 2000
(b) 2001
(c) 2002
(d) 2003
Ans: c
Sol: It is given that 1 person was recruited in each of the departments. This is the key sentence.
There is a dip in average age twice only in Finance. Whenever a person joins or leaves, the average age would be disturbed from its normal increasing value of 1 every year.
Now, as 2 persons have not joined the same department, it must only be in Finance that a person retired in 1 year and another member joined in another year. Because of the fact that all departments have 1 dip in their average age, and Finance has 2, the possibility that the person who retired at 60 years of age and a new faculty member joined in the same year is ruled out.
Furthermore, the normal trend in average age in each department is an increase of 1, which would be the normal behaviour if no person joins in or leaves, unless and until the average age of persons who leave and join in the same year is exactly the same.
Furthermore, as the trend is decrease in age and it is happening only once in each of the departments except Finance, the possibility that the average age would increase when a person joins is ruled out as only 1 person joins in the entire period in the data set.Now, let us assume that the person who retired at the age of 60 years from the Finance department, retired in the period 2nd April, 2000 - 31st March, 2001, both dates inclusive. So, the average age of the faculty members as on 1st April, 2001, should be (50.2 × 5 + 5 - 60)/4) years = 49 years, which matches perfectly with the data given.
Thus, the person that retired must have done so in the period given.
Now, there is a dip in the average age of faculty of the Finance department in the year 2002.
So, let us now evaluate if it matches with the data given.
If a person of 25 years of age joins the Finance department on 1st April, 2002, then the average age of the faculty members on 1st April, 2002 is ((49 × 4 + 4 + 25)/5) years = 45 years, which matches perfectly with the given data.
Thus, the person who joined the Finance department did so in the year 2002.
Hence, answer option 3 is correct.
Set 2
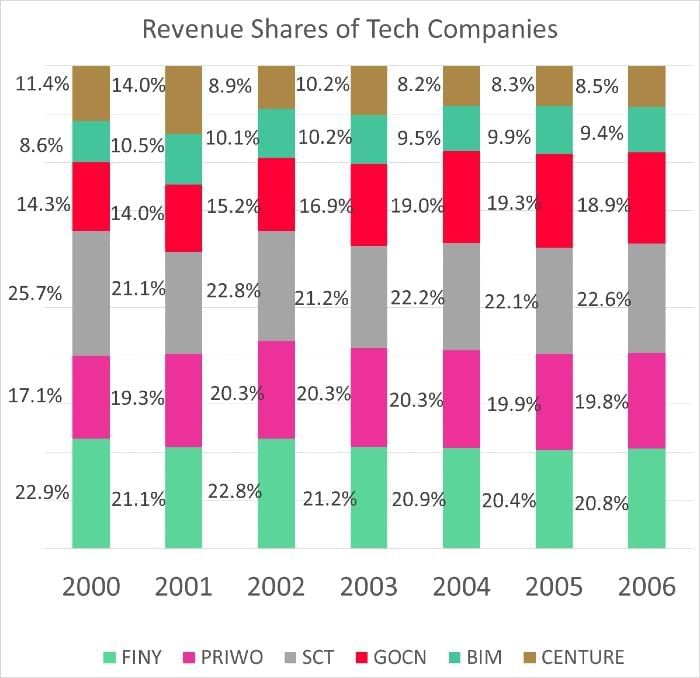
The following chart gives the revenue share of different companies in the tech sector in Cuckooland:
Q1: In 2001, the company that grew the quickest grew by 100%. What was the growth rate of the company that had the least growth rate?
A: 50%
B: 25%
C: 20%
D: 33%
Ans: D
Sol:
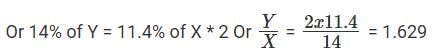
Note that we can answer this question even if we do not know the overall numbers in 2000 and 2001. Let the total revenues of the entire industry be X in 2000 and Y in 2001.FINY has grown from 22.9% of X to 21.1% of Y, which is nothing but
expressed as a percentage.
Likewise, growth of PRIWO would be
And so on for the rest.
So the company that grew the quickest would be the one that had the maximum ration of 2001 revenue share to 2000 revenue share. Only the shares matter, X's and Y's do not matter.
So, to find the company that grew quickest, all we need to do is find the highest ofOf these
is the highest.
Now, we know that CENTURE saw the highest growth and that this growth number was 100%. Or, CENTURE saw its revenues double.
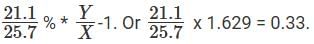
To find out the company that saw the least growth rate, we need to find the least among the listed fractions. Or the least amongThis is clearly
Or, the company that saw the least growth rate is SCT.
SCT's growth rate is
Or, SCT grew by 33%.The question is "growth rate of the company that had the least growth rate?"
Hence, the answer is "33%".
Option D is the correct answer.

Q2: In 2002, the growth rate of the overall sector was 39%, what was the growth rate seen by SCT?
A: 50%
B: 75%
C: 30%
D: 40%
Ans: A
Sol:
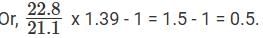
Note that we have done a very detailed analysis of how to go about solving stacked bar charts (similar to pie charts in many ways) in the solution to question 1 in this set. So, kindly go through that to get more insights. Let 2002 revenues be Z, and let 2001 revenues be Y. We know Z/Y = 1.39.
Growth rate of SCT isexpressed as a percentage.
There was a 50% growth rate.The question is "what was the growth rate seen by SCT?"
Hence, the answer is "50%".
Option A is the correct answer.
Q3: Total revenue in 2006 was $21.2 bn, total revenue in 2005 was $18.1 bn. What was the growth rate seen in Centure?
A: 11%
B: 35%
C: 20%
D: 27%
Ans: C
Sol:
Note that we have done a very detailed analysis of how to go about solving stacked bar charts (similar to pie charts in many ways) in the solution to question 1 in this set. So, kindly go through that to get more insights.CENTURE grew from 8.3% of $18.1 bn to 8.5% of $21.2 bn.
Or, from $1.502bn to $1.802bn, a growth rate of 20%.
There was a 20% growth rate.
The question is "What was the growth rate seen in Centure?"
Hence, the answer is "20%".
Option C is the correct answer.
Q4: In 2004, the entire industry added $4bn, of which an increase of $1bn was contributed by COGN, what was the growth rate seen by the entire sector in 2004?
A: 20%
B: 34%
C: 52%
D: Cannot be determined
Ans: B
Sol:
Let 2004 revenues be P and 2003 reveneus be Q.We know that P – Q = $4bn
We also know that 19% of P – 16.9% of Q = $ 1bn.
We need to find P/Q - 1 as a percentage.
It is crucial to isolate what you are looking for in these types of questions.We know that P – Q = $4bn. We also know that 19% of P – 16.9% of Q = $ 1bn.
We know that P – Q = 4(19% of P – 16.9% of Q)
Or P – Q = 0.76P – 0.676Q.
Or, 0.24P = 0.324Q. Or, P/Q = 1.35
Overall growth rate = 35%The question is " what was the growth rate seen by the entire sector in 2004?"
Hence, the answer is "35%".
Option B is the correct answer.
|
77 videos|180 docs|96 tests
|
FAQs on 12 Minute Test: Bar Graphs - Logical Reasoning (LR) and Data Interpretation (DI) - CAT
| 1. What are bar graphs and how are they used? |  |
| 2. How can bar graphs be created and interpreted? | |
| 3. What are the advantages of using bar graphs? | |
| 4. Can bar graphs be used to display time-based data? | |
| 5. Are there any limitations or considerations when using bar graphs? | |


Extra Questions
,practice quizzes
,MCQs
,Important questions
,video lectures
,Sample Paper
,Free
,Objective type Questions
,study material
,12 Minute Test: Bar Graphs | Logical Reasoning (LR) and Data Interpretation (DI) - CAT
,past year papers
,ppt
,Exam
,12 Minute Test: Bar Graphs | Logical Reasoning (LR) and Data Interpretation (DI) - CAT
,shortcuts and tricks
,Semester Notes
,Summary
,Viva Questions
,12 Minute Test: Bar Graphs | Logical Reasoning (LR) and Data Interpretation (DI) - CAT
,mock tests for examination
,Previous Year Questions with Solutions
;


12 Minute Test: Bar Graphs Free PDF Download
Importance of 12 Minute Test: Bar Graphs
12 Minute Test: Bar Graphs Notes
12 Minute Test: Bar Graphs CAT Questions
Study 12 Minute Test: Bar Graphs on the App
|
© EduRev
|
Education Revolution
|


|


