Unit 1: Law of Demand and Elasticity of Demand - 1 Chapter Notes | Business Economics for CA Foundation PDF Download
| Table of contents |

|
| Overview |

|
| Meaning of Demand |

|
| What Determines Demand? |

|
| The Demand Function |

|
| The Law of Demand |

|
Overview
Consider the following hypothetical situation
Aroma Tea Limited is exploring business diversification. During a board meeting, Rajeev Aggarwal, the CEO, inquires of Sanjeev Bhandari, the marketing head, “What do you think, Sanjeev? Should we also venture into the green tea market? What does the current market indicate? Who are the competitors? How will green tea demand impact our black tea sales? Is green tea considered a luxury or a necessity now? What are the main factors influencing green tea demand? Will coffee or soft drink consumers switch to green tea? Your insights on these questions will help us with pricing and brand positioning in the market. Before making a decision, I need a report explaining why you believe green tea could become a leading product for our company in the next five years.”
As an entrepreneur or company manager, you often encounter similar inquiries. Why do prices fluctuate due to events like weather changes, wars, pandemics, or new discoveries? Why can some producers command higher prices than others? The answers to these questions—and many more—are found in demand and supply theory.
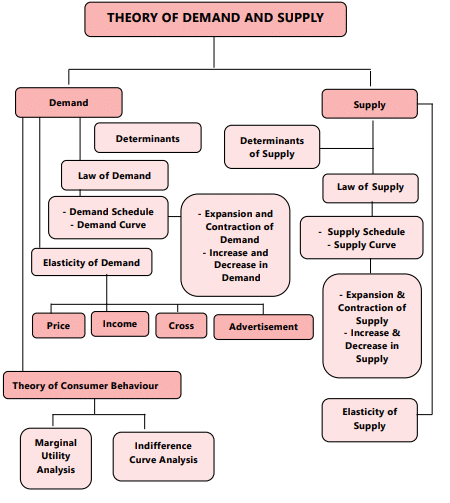
The market system operates under the market mechanism where demand and supply are the forces driving market economies. Together, they determine the price and quantity sold of goods or services. Buyers make up the demand side, while sellers constitute the supply side. Since businesses produce goods and services to sell in the market, understanding how much of their products buyers will want during a specific time is crucial. Buyers include consumers, businesses, and even the government. The quantity demanded at a certain price helps define the market size. As we know, market size significantly influences a firm's prospects.
In a competitive market, behavior is accurately described by the demand and supply model. Demand and supply refer to the actions of buyers and sellers as they interact in markets. Hence, a comprehensive understanding of demand and supply theory is essential for any business. This unit will focus on studying the theory of demand.
Meaning of Demand
The term ‘demand’ refers to the amount of a good or service that consumers are willing and able to purchase at different prices over a specific time period. It is important to note that demand, in economics, encompasses more than just the desire to buy; desire is simply one aspect of it. For instance, individuals may wish for larger homes or luxury vehicles, but they face limitations such as product prices and financial capabilities. Therefore, the combination of wants or desires with real-world constraints influences their purchasing decisions. Effective demand for a product relies on three factors: (i) desire, (ii) means to purchase, and (iii) willingness to spend those means. Without the backing of purchasing power or the ability and willingness to pay, desire alone does not equate to demand. Only effective demand is relevant in economic analysis and business strategies.
Two key points regarding quantity demanded are:
- The quantity demanded is always specified at a particular price. Different prices typically result in varying quantities of a commodity being demanded.
- The quantity demanded represents a flow. Our focus is not on a singular purchase, but rather on a continuous stream of purchases, necessitating the expression of demand in terms of 'so much per time period,' such as one thousand dozens of oranges per day or seven thousand dozens per week.
In summary, “demand refers to the various quantities of a specific commodity or service that consumers would purchase in a market within a defined time frame, at different prices, varying incomes, or in relation to the prices of related goods.”
What Determines Demand?
Common Determinants of Demand
Understanding the common determinants of demand for a product or service is crucial for businesses in estimating market demand. Various factors influence demand, and while not all are equally significant, they play important roles. Some factors are also challenging to quantify. Below are the key factors that determine demand.
Price of the Commodity: The price of a good is a primary determinant of its demand. Ceteris paribus (other factors being equal), demand is inversely related to price; when the price rises, quantity demanded decreases, and vice versa. This relationship is influenced by income and substitution effects.
Price of Related Commodities: Related commodities fall into two categories:
- Complementary Goods: These are consumed together (e.g., tea and sugar, cars and petrol). An increase in demand for one leads to an increase in demand for the other. A price drop in one complements results in increased demand for the other.
- Substitute Goods: These satisfy the same wants and can replace each other (e.g., tea and coffee). A price increase in one leads to decreased demand for it but increases demand for its substitute. Conversely, a price decrease in one leads to increased demand for it and decreased demand for its substitutes.
Disposable Income of the Consumer: A consumer's purchasing power is determined by their disposable income. Generally, an increase in disposable income raises demand for certain goods at given prices, while a decrease lowers demand. The relationship between income and demand varies depending on the type of goods:
- Normal Goods: Demand increases as income rises.
- Inferior Goods: Demand rises up to a certain income level but decreases as income continues to rise.
- Luxury Goods: Demand increases as income rises beyond a certain point.
Tastes and Preferences of Buyers: Demand is influenced by consumer preferences, which may change over time. New, fashionable goods tend to have higher demand than outdated ones. External factors like the demonstration effect, bandwagon effect, Veblen effect, and snob effect also influence demand:
- Demonstration Effect: Consumers may desire a product after seeing others with it.
- Bandwagon Effect: Increased demand due to others consuming the same product.
- Snob Effect: Decreased demand when a product becomes common among consumers, as some wish to be exclusive.
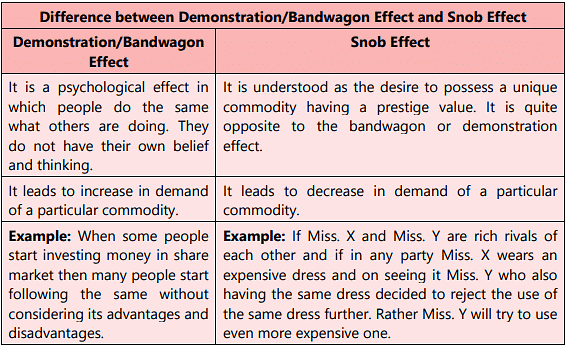
Highly priced goods are purchased by affluent individuals seeking to fulfill their desire for conspicuous consumption, a phenomenon known as the ‘Veblen effect,’ named after American economist Thorstein Veblen. Examples include luxury cars and jewelry. The difference between the snob effect and the Veblen effect is that the former is based on the consumption patterns of others, while the latter focuses on the price of goods. It is evident that consumer tastes and preferences evolve due to various external and internal factors, impacting demand.
Understanding consumer tastes and preferences is crucial for manufacturers and marketers, as this knowledge aids in the design of new products and services and informs production planning to align with changing customer needs.
Consumers’ Expectations
Current demand is influenced by consumers’ expectations concerning future prices, income, supply conditions, etc. If consumers anticipate rising future prices, increased income, or supply shortages, they will demand more goods. Conversely, expectations of falling prices or income may lead consumers to delay purchases of nonessential items, causing current demand to decrease. Consumer and business confidence regarding future economic conditions also impacts spending and demand.
Other Factors Influencing Demand
- Size of Population: Generally, a larger population leads to more buyers, resulting in higher quantity demanded at every price level. The reverse is true for smaller populations.
- Age Distribution of Population: A higher proportion of older individuals may increase demand for geriatric services and products, while a younger population boosts demand for items like toys and baby food. Additionally, rural to urban migration affects demand for goods and services in respective areas.
- Level of National Income and Its Distribution: The overall national income level is a critical demand determinant. Higher national income typically increases demand for normal goods and services. However, with uneven wealth distribution, demand for consumer goods may be lower due to the reduced propensity to consume among wealthier individuals compared to poorer ones. More equitable income distribution tends to raise overall consumption and demand.
- Consumer Credit Facility and Interest Rates: Availability of credit encourages higher consumption than what current incomes might allow. Low-interest rates generally lead to increased borrowing, thus boosting demand for both investment and durable goods.
- Government Policies and Regulations: Government actions, such as taxation, expenditure, and subsidies, significantly influence demand. Taxes typically raise prices and reduce demand, while subsidies lower prices and enhance demand. For example, taxes on luxury items and subsidies for renewable energy products. Government regulations on trade can also impact domestic demand.
Other factors like weather, business conditions, economic cycles, wealth, education levels, marital status, socioeconomic class, social customs, and advertising also significantly affect demand.
The Demand Function
As we know, a function is a symbolic statement of a relationship between the dependent and the independent variables. The demand function states in equation form, the relationship between the demand for a product (the dependent variable) and its determinants (the independent or explanatory variables). Any other factors that are not explicitly listed in the demand function are assumed to be irrelevant or held constant. A simple demand function may be expressed as follows:
Qx = f (PX, Y, Pr,)
Where Qx is the quantity demanded of product X
PX is the price of the commodity
Y is the money income of the consumer, and
Pr is the price of related goods
The demand function stated as above does not indicate the exact quantitative relationship between Qx and PX, M and Pr,. For this, we need to write the demand function in a particular form with specified values of the explanatory variables appearing on the right-hand side. For example; we may write Qx = 45 + 2y + 1 Pr, – 2 P. In this unit, we will be studying demand as a function of only price, keeping everything else constant.
The Law of Demand
Most individuals have an inherent understanding of the law of demand, which is a fundamental principle in economic theory. This law describes the relationship between the quantity demanded for a product and its price. Professor Alfred Marshall defined it as follows: “The greater the amount to be sold, the smaller must be the price at which it is offered in order that it may find purchasers; in other words, the amount demanded increases as the price falls and decreases as the price rises.”
The law of demand indicates that, all else being equal, when the price of a good increases, the quantity demanded for that good will decrease. Thus, there exists an inverse relationship between price and quantity demanded, ceteris paribus. The term 'other things' refers to constant factors such as the prices of related goods, consumer income, consumer preferences, and all other elements that can influence demand. If any of these factors change, the inverse relationship between price and demand may not hold true. For instance, if consumer incomes rise, an increase in the price of a commodity may not lead to a decrease in its quantity demanded. Therefore, the stability of these 'other factors' is a crucial assumption of the law of demand.
The quantity demanded represents the amount of a good or service that consumers are prepared to purchase at a specific price, assuming all other factors influencing purchases remain unchanged. The quantity demanded for a good or service can surpass the actual quantity sold. The Law of Demand can be demonstrated through a demand schedule and a demand curve.
The Demand Schedule
A demand schedule is a chart that displays the quantities of a product that consumers are willing to buy at various prices over a specified period, assuming all other factors remain constant. To demonstrate the relationship between the quantity demanded of a product and its price, we can use hypothetical data for the prices and quantities of ice cream. A demand schedule is created under the assumption that all other influences stay the same. It aims to isolate the effect of the product's price on the quantity sold.
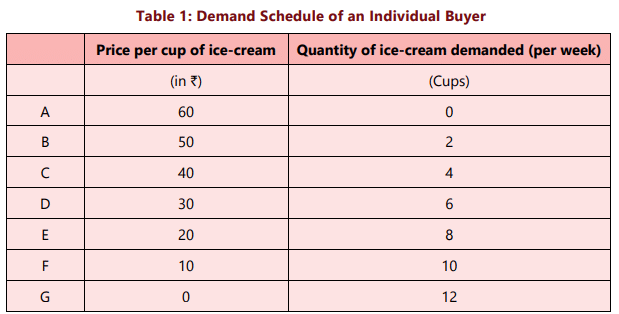
Table 1 illustrates the number of cups of ice cream purchased weekly by this specific buyer at varying price levels, while keeping all other factors influencing ice cream consumption constant. When the price is zero (₹0), she consumes 12 cups of ice cream weekly. As the price increases, her purchases decrease. At a price of ₹60 per cup, she completely stops buying ice cream. The table demonstrates an inverse relationship between price and the quantity of ice cream demanded. It is evident that the demand schedule adheres to the law of demand: as the price of ice cream rises, ceteris paribus, the quantity demanded decreases.
The Demand Curve
A demand curve visually represents the demand schedule. Typically, the vertical axis indicates the price per unit of the good, while the horizontal axis shows the quantity of the good, often measured in a physical unit over a specific time period. By plotting each set of values as points on a graph and connecting these points, we create an individual demand curve for a product. This curve illustrates the relationship between the quantities that consumers are willing to purchase and the price of the good. We can now graph the data from Table 1.
In Fig. 1, we have shown such a graph and plotted the seven points corresponding to each price-quantity combination shown in Table 1. The demand curve hits the vertical axis at price ₹60 indicating that no quantity is demanded when the price is ₹ 60 (or higher). The demand curve hits the horizontal quantity axis at 12, the amount ice-cream that the consumer wants if the price is zero. Point A shows the same information as the first row of Table 1, and Point G shows the same information as does the last row of the table.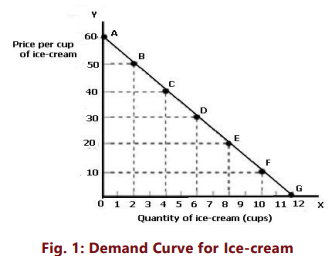
We now create a smooth curve connecting these points. This curve represents the demand curve for ice cream and illustrates the quantity of ice cream that consumers wish to purchase at various prices. The negative or downward slope signifies that as the price decreases, the quantity demanded increases. Typically, consumers are inclined to buy more when prices are lower. In summary, a greater quantity of a good will be acquired at reduced prices. Therefore, the downward-sloping demand curve aligns with the law of demand, which describes an inverse relationship between price and demand.
The slope of a demand curve is - ∆P/∆Q (i.e the change along the vertical axis divided by the change along the horizontal axis). The negative sign of this slope is consistent with the law of demand.
The demand curve for a good does not have to be linear or a straight line; it can be curvilinear- meaning its slope may vary along the curve. If the change in quantity demanded does not follow a constant proportion, then the demand curve will be non linear. However, linear demand curves provide a convenient tool for analysis.
Market Demand Schedule
The market demand for a commodity represents the different quantities of that commodity that all buyers in the market are willing to purchase over a specific time period at various price points, assuming all other factors remain unchanged. In essence, it reflects the total amount that all buyers are ready to acquire per time unit at a specified price. Consequently, the market demand for a commodity relies on all the determinants that influence individual demand, along with the total number of buyers in the market.
When we add up the various quantities demanded by different consumers in the market, we can obtain the market demand schedule. How the summation is done is illustrated in Table 2. Suppose there are only two individual buyers of good X in the market namely, A and B. The Table 2 shows their individual demand at various prices.
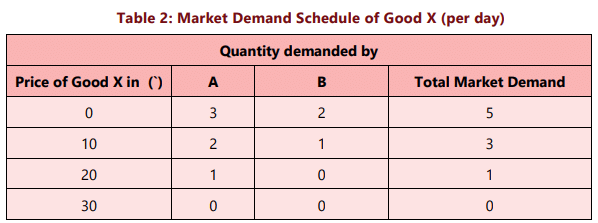
When we add the quantities demanded at each price by consumers A and B, we get the total market demand. Thus, when good X is free or price is zero per unit, the market demand for commodity ‘X’ is 5 units (i.e.3+2). When price rises to ₹ 10, the market demand is 3 units. At a price of ₹ 20, only one unit is demanded in the market. At price ₹ 30, both A and B do not buy good X and therefore, market demand is zero. The market demand schedule also indicates inverse relationship between price and quantity demanded of ‘X’.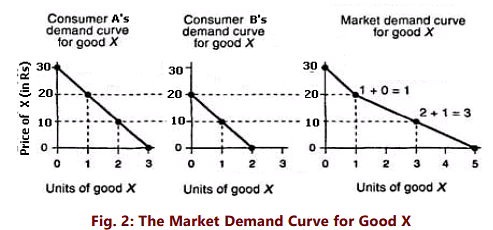
The Market Demand Curve
The market demand curve for good X represents the quantities of good X demanded by all buyers in the market for good X. The market demand curve is obtained by horizontal summation of all individual demand curves.
If we plot the market demand schedule on a graph, we get the market demand curve. Figure 2 shows the market demand curve for commodity ‘X’. The two consumers A and B have different individual demand curves corresponding to their different preferences for good X. The two individual demand curves are shown in Figure 2 along with the market demand curve for good X. When there are more than two consumers in the market for some good, the same principle continues to apply and the market demand curve would be the horizontal summation of all the market participants' individual demand curves. The market demand curve, like the individual demand curve, slopes downwards to the right because it is nothing but the lateral summation of individual demand curves.
In addition to the demand schedule and the demand curve, the buyers' demand for a good can also be expressed algebraically, using a demand equation. The demand equation relates the price of the good, denoted by P, to the quantity of the good demanded, denoted by Q. The straight-line demand curve where we hold everything else constant is described by a linear demand function. We can write a demand function as follows: Q = a - bP
Where ‘a’ is the vertical intercept and ‘b’ is the slope.
For example: For a demand function Q = 100 ‐2P
Rationale of the Law of Demand
Normally, the demand curves slope downwards. This indicates that consumers purchase more at lower prices. Below, we explore the reasons behind the downward slope of demand curves, or why people tend to buy more when prices decrease. Various economists have provided differing explanations for the law of demand, which are outlined as follows:
- Price Effect of a Fall in Price: The price effect describes how consumer purchases of good X change when its price varies. This effect consists of two components: the substitution effect and the income effect.
- Substitution Effect:Hicks and Allen have articulated the law in terms of substitution and income effects. The substitution effect refers to the change in demand for a product when its relative price changes. As the price of a commodity decreases, it becomes relatively cheaper compared to other products. Assuming prices of other goods remain constant, this encourages consumers to substitute the cheaper product for other, now relatively more expensive, items. Consequently, the overall demand for the cheaper commodity increases. The substitution effect is always positive when prices fall, leading to higher demand. The strength of the substitution effect increases with:
- (a) closer substitutes
- (b) lower costs associated with switching to the substitute
- (c) less inconvenience when switching to the substitute
- Income Effect: The rise in demand due to an increase in real income is known as the income effect. When a commodity's price decreases, consumers can purchase the same quantity with less money or buy more of it with the same amount. Thus, a drop in price enhances consumers' real income or purchasing power. This increased real income can lead to the purchase of more of the commodity, provided it is a normal good. An exception exists for inferior goods, where the income effect opposes the substitution effect. For inferior goods, demand expansion following a price drop will occur only if the substitution effect is greater than the income effect.
- Utility Maximizing Behavior of Consumers: A consumer achieves equilibrium (maximizing satisfaction) when the marginal utility of a commodity equals its price. According to Marshall, a consumer experiences diminishing utility for each additional unit of a commodity and will thus be willing to pay less for each successive unit. Rational consumers will not spend more for less satisfaction and will be encouraged to buy more units only when prices decrease. The interplay of diminishing marginal utility and the consumer's effort to equalize utility with price leads to a downward sloping demand curve.
- Arrival of New Consumers: A decrease in the price of a commodity attracts more consumers, as those who previously couldn't afford it may now be able to purchase it. This increases the number of consumers for a commodity at a lower price, thereby raising demand.
- Different Uses: Many products serve multiple purposes. When the prices of such items are high, they are utilized for only a few purposes. However, if prices decrease, these commodities can be employed for a greater variety of uses, resulting in increased demand. For example, lower electricity prices can lead to broader usage.
Exceptions to the Law of Demand
The law of demand states that, all else being equal, a greater quantity of a commodity will be demanded at lower prices than at higher prices. While this principle is generally applicable, there are notable exceptions:
- Conspicuous goods: These are prestige items that wealthy individuals purchase to showcase their social status. According to Veblen's "Conspicuous Consumption," higher prices can increase their attractiveness. For instance, diamonds are an example; as their prices rise, their prestige value increases, leading to higher demand.
- Giffen goods: Named after economist Sir Robert Giffen, these goods defy the law of demand. For example, when bread prices increased, British workers bought more bread because they could no longer afford more expensive foods, thus consuming more of the cheaper staple. Giffen goods are typically inferior goods without close substitutes that occupy a significant portion of a consumer's budget, such as coarse grains like bajra and low-quality rice.
- Conspicuous necessities: Certain goods become necessities due to social influences and constant use. Despite rising prices, the demand for items like televisions and refrigerators does not decrease.
- Future expectations about prices: When prices are expected to rise further, consumers may buy more of a commodity even if its price is increasing. For instance, during a drought, people might stock up on food grains anticipating future price hikes. Conversely, if prices are falling, they may delay purchases.
- Incomplete information and irrational behavior: The law of demand assumes rational consumer behavior. However, when consumers lack complete information, they may make inconsistent purchasing decisions or buy impulsively at higher prices, leading to demand that contradicts the law.
- Demand for necessaries: For essential goods, consumers need a minimum quantity regardless of price changes, making the law of demand less applicable.
- Speculative goods: In speculative markets, such as stocks, demand increases as prices rise and decreases when prices fall.
The law of demand may also not hold if other factors affecting demand, like consumer income, prices of related goods, or changes in preferences, experience significant changes.
|
86 videos|255 docs|58 tests
|
FAQs on Unit 1: Law of Demand and Elasticity of Demand - 1 Chapter Notes - Business Economics for CA Foundation
| 1. What is the meaning of demand? |  |
| 2. What determines demand? |  |
| 3. What is the demand function? |  |
| 4. What is the law of demand? |  |
| 5. What is elasticity of demand? |  |


