Financial and Operating leverage | Management Optional Notes for UPSC PDF Download
| Table of contents |

|
| Introduction |

|
| Meaning of Leverage |

|
| Types of Leverage |

|
| Operating Leverage |

|
| Financial leverage |

|
| Financial Leverage as ‘Trading on Equity' |

|
| Combined leverage |

|
Introduction
The primary objective of financial management is to maximize wealth, where wealth refers to market value. The value of a company is directly linked to its performance and inversely related to investor expectations. Consequently, investor expectations are influenced by the company's risk profile. Therefore, to enhance value, a company must effectively manage its risk, which may encompass business risk, financial risk, or a combination of both. This chapter delves into the factors that influence both business and financial risks.
Meaning of Leverage
The term "leverage" denotes influence or power. In financial analysis, leverage denotes the impact of one financial variable on another related financial variable. These variables may include costs, output, sales revenue, Earnings Before Interest and Tax (EBIT), Earnings per Share (EPS), and so forth. Generally, when assessing the impact of a change in variable X on variable Y, it is referred to as the leverage of Y with respect to X, and it is calculated as follows:

Types of Leverage
Three widely used measures of leverage in financial analysis include:
- Operating Leverage: This measure assesses the relationship between Sales and EBIT, indicating business risk.
- Financial Leverage: This measure examines the relationship between EBIT and EPS, highlighting financial risk.
- Combined Leverage: This measure evaluates the relationship between Sales and EPS, providing insights into total risk.
Chart Showing Operating Leverage, Financial Leverage and Combined leverage

Operating Leverage
Operating Leverage means tendency of operating income (EBIT) to change disproportionately with change in sale volume. This disproportionate change is caused by operating fixed cost, which does not change with change in sales volume. In other words, operating leverage (OL) maybe defined as the employment of an asset with a fixed cost so that enough revenue can be generated to cover all the fixed and variable costs.
The use of assets for which a company pays a fixed cost is called operating leverage. Operating leverage is a function of three factors:
- Amount of fixed cost,
- ariable contribution margin, and
- Volume of sales.
Degree of Operating Leverage (DOL)
When we measure magnitude of disproportionate change it is termed as degree of leverage. Degree of Operating Leverage may be defined as percentage change in EBIT with respect to percentage change in sales quantity.
 Mathematically:

Here, EBIT = Q (S-V) - F
- Q = sales quantity
- S = selling price per unit
- V = variable cost per unit
- Δ Denotes change

Now ∆F is nil because change in fixed cost is nil. Therefore:


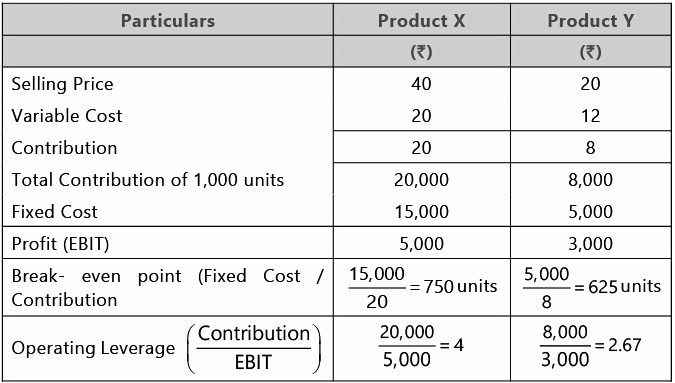
Break-Even Analysis and Operating Leverage Break-even analysis is a generally used to study the Cost Volume Profit analysis. It is concerned with computing the break-even point. At this point of production level and sales there will be no profit and loss i.e. total cost is equal to total sales revenue.

Let us Understand through the following example:

There is a relationship between leverage and Break-even point. Both are used for profit planning. In brief the relationship between leverage,break-even point and fixed cost as under:

Margin of Safety and Operating Leverage
In cost accounting, one studies that margin of safety (MOS) may be calculated as follows:

Higher margin of safety indicates lower business risk and higher profit and vice versa. If we both multiply and divide above formula with profit volume (PV) ratio then:

we know that:

So

we know that:
 hence:

Let us Understand through the following example:


When the Degree of Operating Leverage (DOL) exceeds one (1), it indicates the presence of operating leverage. The higher the DOL, the greater the operating leverage.
A positive DOL or Operating Leverage signifies that the firm is operating above the breakeven point, with both sales and EBIT moving in the same direction. Conversely, a negative DOL or Operating Leverage indicates that the firm operates below the breakeven sales, resulting in negative EBIT.
Scenario 1: No Fixed Costs


Situation 2: Positive Leverage


Situation 3: When EBIT is Nil (contribution = fixed cost)
 Analysis and Interpretation of operating leverage


Note: DOL can never be between zero and one. It can be zero or less or it can be one or more.

When sales significantly exceed the breakeven point (BEP) sales, the Degree of Operating Leverage (DOL) will be slightly greater than one. As sales decrease, DOL will increase. At the breakeven point, DOL becomes infinite. When sales are slightly below the breakeven point, DOL will be negative infinite. Further reductions in sales will cause DOL to approach zero. At zero sales, DOL will also be zero.
Example 1
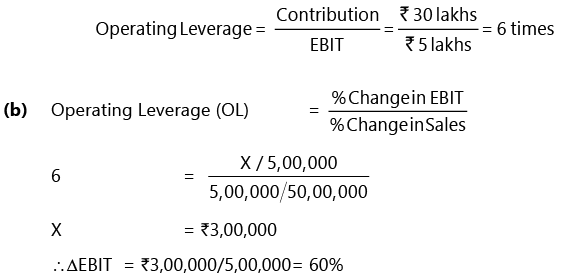
A company produces and sells 10,000 shirts at a selling price of 500 per shirt. The variable cost is 200 per shirt, and the fixed operating cost is ` 25,00,000.
(a) DETERMINE the operating leverage.
(b) If sales increase by 10%, then CALCULATE the impact on EBIT.
Solution: (a) Statement of Profitability


Financial leverage
Financial leverage (FL) can be described as "the utilization of capital with a fixed cost to enhance earnings per share." Essentially, it involves deploying company funds that incur a fixed expense in anticipation of boosting returns for common stockholders.

In the equations provided:
- EBIT represents the earnings before interest and taxes, calculated as sales minus the sum of variable costs and fixed costs.
- EBT stands for earnings before taxes, derived from EBIT minus the interest expense.
Regarding the Degree of Financial Leverage (DFL), it signifies the ratio between the percentage rise in earnings per share (EPS) and the percentage increase in earnings before interest and taxes (EBIT). Financial Leverage (FL) is alternatively defined as "the capacity of a company to utilize fixed financial expenses to amplify the impact of EBIT changes on EPS."


Δ EPS means change in EPS and Δ EBIT means change in EBIT
now EPS = [ (EBIT - I) (1- t) ] - D / No. of Shares
Here
T = Tax Rate
D = Dividend on Preference Shares (inclusive of dividend tax if any) on simplifying the above we get,

If the Degree of Financial Leverage (DFL) exceeds one (1), it indicates the presence of financial leverage. The higher the DFL, the greater the financial leverage.
A positive DFL/FL suggests that the firm operates above the break-even point, with both EBIT and EPS trending in the same direction. Conversely, a negative DFL/FL signifies operation below the break-even point, resulting in negative EPS.
Let us understand through the following analysis:
Situation 1: No Fixed Interest Charges


Situation 2. Positive Financial Leverage


 Situation 3. When EBT is nil (EBIT = Fixed Interest)


Analysis and Interpretation of Financial leverage

Financial Leverage as ‘Trading on Equity'
- ’Financial Leverage, also known as "Trading on Equity," involves utilizing funds with fixed costs such as long-term debts and preference share capital alongside equity share capital. The primary objective of financial leverage is to enhance the earnings available to equity shareholders by leveraging fixed-cost funds. A positive leverage occurs when a firm's earnings exceed the cost of debt, while an unfavorable leverage occurs when earnings are equal to or less than the cost of debt. When the proportion of fixed-cost funds is relatively high compared to equity capital, it is referred to as "trading on equity."
Financial Leverage, often likened to a "Double-Edged Sword,"
When the cost of fixed-cost funds is lower than the return on investment, financial leverage can enhance the return on equity and EPS. Additionally, the firm can benefit from tax savings on interest payments. However, if the cost of debt exceeds the return, it can unfavorably impact the return on equity and EPS, potentially leading the firm into financial distress. This dual nature of financial leverage is why it is often referred to as a "double-edged sword."
Impact on EPS and ROE:
- When ROI > Interest: Favorable, Advantageous
- When ROI < Interest: Unfavorable, Disadvantageous
- When ROI = Interest: Neutral, Neither advantageous nor disadvantageous.
It's worth noting that the Degree of Financial Leverage (DFL) cannot fall between zero and one; it can be zero or negative, or it can be one or greater.

- *Financial BEP is the level of EBIT at which earning per share is zero. If a company has not issued preference shares then Financial BEP is simply equal to amount of Interest.
- When EBIT significantly exceeds the Financial Break-Even Point (BEP), the Degree of Financial Leverage (DFL) will be slightly more than one. As EBIT decreases, DFL will increase. At the Financial BEP, DFL will be infinite. If EBIT is slightly less than the Financial BEP, DFL will be negative infinite. Further reductions in EBIT will cause DFL to approach zero. At zero EBIT, DFL will also be zero.
Combined leverage
Combined leverage refers to the potential utilization of both operating and financial fixed costs, which amplifies the impact of changes in sales volume on the earnings per share of the firm.
- Combined Leverage (CL) = Operating Leverage (OL) × Financial Leverage (FL)

Degree of Combined Leverage (DCL)
The Degree of Combined Leverage (DCL) is the ratio of the percentage change in earnings per share to the percentage change in sales. It illustrates the impact that changes in sales will have on EPS.

Like operating leverage and financial leverage, combined leverage can also be positive and negative combined leverage.
Analysis of combined leverage
Combine leverage measures total risk. It depends on combination of operating and financial risk.


Example 3: A firm’s details are as under:
- Sales (@100 per unit) Rs 24,00,000
- Variable Cost 50%
- Fixed Cost Rs 10,00,000
It has borrowed Rs 10,00,000 @ 10% p.a. and its equity share capital is Rs 10,00,000 (Rs 100 each) CALCULATE:
(a) Operating Leverage
(b) Financial Leverage
(c) Combined Leverage
(d) Return on Investment
(e) If the sales increases by Rs 6,00,000; what will the new EBIT?
Solution:


(e) Operating Leverage = 6

Increase in EBIT = Rs 2,00,000 × 1.5 = Rs 3,00,000
New EBIT = 5,00,000
FAQs on Financial and Operating leverage - Management Optional Notes for UPSC
| 1. What is the meaning of leverage? |  |
| 2. What are the types of leverage? |  |
| 3. What is operating leverage? |  |
| 4. What is financial leverage? |  |
| 5. What is combined leverage? |  |

|
Explore Courses for UPSC exam
|

|


