Home Assignment: 14 | Class 10 BBC Compacta Solutions PDF Download
Writing (Analytical Paragraph)
Q: The Readers Club of a school recently conducted a survey to study the habit of reading among students. The pie charts given below show the compiled results in percentages. Use the data to write an analytical paragraph to summarise the findings of the survey. Make comparisons wherever appropriate and draw conclusions.

Frequency of reading among students aged 12 to 17
Ans: The survey conducted by the Readers Club provides a detailed perspective on the reading habits and preferences of students. According to the first pie chart, 15% of students do not engage in reading outside of their academic requirements, indicating a segment of the student body that could be targeted for initiatives to encourage reading. A majority of students, 40%, read regularly, while 35% read only sometimes, suggesting that reading is a habit for many but not consistently practiced by all.
The second pie chart focuses on the types of literature the students are interested in, revealing that a significant majority, 60%, prefer fiction, which often appeals to the imagination and offers a form of escapism. Biographies and travel books each capture the interest of 10% of the students, indicating a decent interest in real-life stories and cultural exploration. Poetry and drama have a smaller but still noteworthy audience at 10% and 5% respectively.
The third pie chart shifts the focus to periodicals, where film magazines command the largest share at 52%. This high percentage could reflect a strong interest in the entertainment industry and popular culture among students. Newspapers and sports magazines also have a substantial readership at 30% and 10%, suggesting that students are also engaged with current events and sports. Science journals, with an 8% readership, indicate a specialized interest group dedicated to academic and scientific pursuits.
In conclusion, while a majority of students at the school engage with reading to some extent, fiction is the most popular genre, indicating a preference for narrative and story. Interest in periodicals leans heavily towards film, possibly due to the visual and celebrity-driven culture prevalent among students. These findings could guide the Readers Club in organizing related activities and selecting reading materials that cater to the diverse interests of the student body.
Additional Practice Task
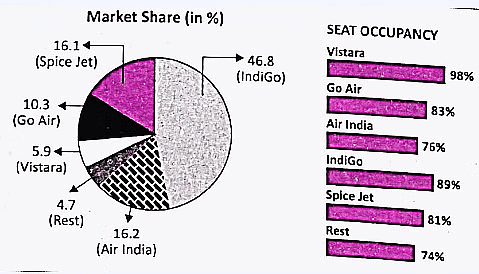
Q: The following bar graph and pie-chart show the seat occupancy and market share in per cent that six domestic airlines had last year. Study the data carefully and write an analytical paragraph in words. Make comparisons where appropriate and draw conclusions.

Ans: The provided data illustrates the dynamic between market share and seat occupancy for six domestic airlines over the last year. IndiGo, with a market share of 46.8%, stands out as the industry leader, suggesting strong brand presence and business operations. Spice Jet, while having a smaller market share of 16.1%, still maintains a relatively high seat occupancy rate of 81%, indicating effective capacity management. Go Air, with a 10.3% market share, boasts a high seat occupancy rate of 98%, reflecting exceptional efficiency in filling seats relative to its market size.
Vistara, holding 5.9% of the market, leads in seat occupancy at 98%, suggesting it is a preferred choice for travelers when available. Air India, with a significant market share of 16.2%, has a lower seat occupancy rate of 83%, which may point to challenges in maximizing capacity or competition with other airlines. The category labeled 'Rest' encompasses the smallest market share of 4.7% and the lowest seat occupancy of 74%, indicating that these smaller players face more substantial challenges in attracting and retaining passengers.
The contrast between market share and seat occupancy rates can reflect various strategies and operational efficiencies of the airlines. High seat occupancy does not necessarily equate to a large market share, as seen with Go Air and Vistara, but it does indicate a strong operational performance in terms of maximizing revenue per flight. Conversely, a large market share like that of IndiGo suggests broad operational reach but does not guarantee optimal seat occupancy, as their rate is lower than some competitors. Overall, the data reveals that success in the airline industry can be measured by a combination of market penetration and the ability to efficiently fill seats.

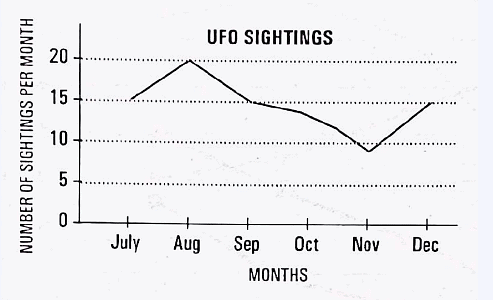
UFOs or Unidentified Flying Objectes continue to be sighted at various places in North India. The data for the last six months of the last year shows that these incidents have shown a fluctuating trend. According to the given line graph, as many as 15 UFO sightings were reported in the month of July. The month of August registered a thirtythree percent increase in such sightings. However, between September and November, the sightings fell sharply from 15 to under 10 before their numbers shot up again in December which registered an equal number of UFO sightings as in July and September. Overall, there have been ups and downs in the number of UFO sightings made in the last six months in North India although the data does not indicate the type of UFOs sighted, where and by whom and whether the claim could be verified by scientists or not.
Ans: The line graph depicts a six-month trend of UFO sightings in North India from July to December of the previous year, revealing an erratic pattern in reported incidents. In July, there were 15 reported sightings, which increased by 33% in August, indicating a heightened occurrence of such events. Subsequently, there was a noticeable decline, with sightings dropping below 10 between September and November.
The decrease during these autumn months could point to various factors, including seasonal changes affecting visibility or public vigilance. Remarkably, December saw a resurgence in sightings, matching the numbers of July and September with 15 incidents. This could suggest a cyclical trend or an increased interest in sky-watching activities during specific periods.
Despite the variability, the graph does not provide specifics about the nature of the UFOs, their exact locations, the observers' identities, or any scientific verification of the sightings. The data illustrates that while UFO sightings are subject to fluctuation, interest or occurrences do not wane, maintaining a consistent presence with peaks and troughs throughout the latter half of the year.


