Class 10 Exam > Class 10 Notes > Chemistry for GCSE/IGCSE > Graph Interpretation for Rate of a Reaction
Graph Interpretation for Rate of a Reaction | Chemistry for GCSE/IGCSE - Class 10 PDF Download

Interpreting Data
- Data recorded during rate studies is utilized for plotting graphs to compute the rate of a reaction
- Graph plotting until the reaction's completion illustrates how the rate alters over time
- As reactants deplete, the reaction rate diminishes, leading the line to become less steep and eventually horizontal, indicating reaction completion
- Multiple runs of a variable can be plotted on a single graph to visualize how it affects the rate; for instance, examining how concentration impacts a reaction involving acid and marble chips
- For example, plotting the effect of concentration on a reaction between the acid and marble chips
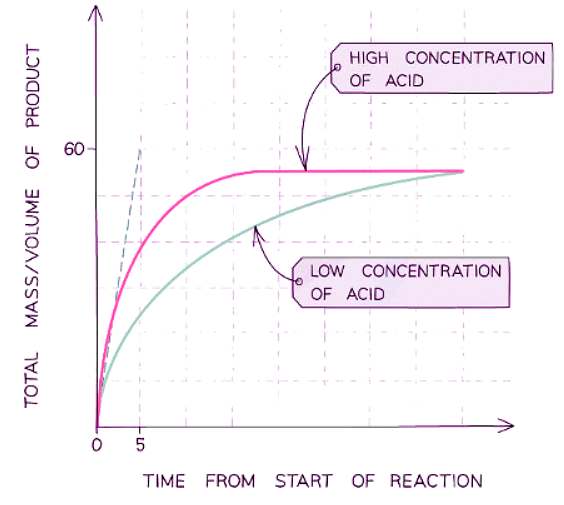
- A steeper curve indicates a faster reaction rate, with the initial steepness indicating the quickest rate at the reaction's outset.
- As the reaction progresses, the decreasing concentration of reactants causes the rate to diminish, reflected by the curve becoming less steep.
- When a reactant is depleted, the reaction halts, the rate becomes zero, and the curve flattens into a horizontal line.
- The quantity of product produced is determined by the limiting reactant: an increase in the limiting reactant leads to a rise in product formation, while an excess reactant does not affect product quantity.
- Drawing a tangent to the slope enables the gradient to be displayed at any point on the curve, indicating the reaction rate.
- The gaseous product's volume reaches a maximum over time, causing the line to plateau, signaling the reaction's completion.
- Given the proportional relationship between volume and mass, this graph could also represent product mass versus time.
Question for Graph Interpretation for Rate of a ReactionTry yourself: What does a steeper curve on a graph plotting the rate of a reaction indicate?View Solution
The document Graph Interpretation for Rate of a Reaction | Chemistry for GCSE/IGCSE - Class 10 is a part of the Class 10 Course Chemistry for GCSE/IGCSE.
All you need of Class 10 at this link: Class 10
|
71 videos|147 docs|61 tests
|
FAQs on Graph Interpretation for Rate of a Reaction - Chemistry for GCSE/IGCSE - Class 10
| 1. What factors can affect the rate of a chemical reaction? |  |
Ans. Factors that can affect the rate of a chemical reaction include temperature, concentration of reactants, surface area, presence of a catalyst, and pressure for gas-phase reactions.
| 2. How does an increase in temperature affect the rate of a reaction? | |
Ans. An increase in temperature usually leads to an increase in the rate of a reaction as it provides more energy for the reacting particles to collide with greater force and frequency.
| 3. What role does the concentration of reactants play in determining the rate of a reaction? | |
Ans. The higher the concentration of reactants, the more collisions will occur between particles, leading to an increased rate of reaction due to more frequent successful collisions.
| 4. How does the presence of a catalyst impact the rate of a reaction? | |
Ans. A catalyst can increase the rate of a reaction by providing an alternative pathway with lower activation energy for the reaction to occur, allowing more particles to react successfully.
| 5. Can the rate of a reaction ever be negative? | |
Ans. No, the rate of a reaction is always a positive value as it represents how quickly the products are formed or the reactants are used up. A negative rate would not make physical sense in the context of a chemical reaction.
About this Document

Oct 24, 2025
Last updated
Related Exams
Document Description: Graph Interpretation for Rate of a Reaction for Class 10 2025 is part of Chemistry for GCSE/IGCSE preparation.
The notes and questions for Graph Interpretation for Rate of a Reaction have been prepared according to the Class 10 exam syllabus. Information about Graph Interpretation for Rate of a Reaction covers topics
like Interpreting Data and Graph Interpretation for Rate of a Reaction Example, for Class 10 2025 Exam. Find important definitions, questions, notes, meanings, examples, exercises and tests below for Graph Interpretation for Rate of a Reaction.
Introduction of Graph Interpretation for Rate of a Reaction in English is available as part of our Chemistry for GCSE/IGCSE
for Class 10 & Graph Interpretation for Rate of a Reaction in Hindi for Chemistry for GCSE/IGCSE course.
Download more important topics related with notes, lectures and mock test series for Class 10
Exam by signing up for free. Class 10: Graph Interpretation for Rate of a Reaction | Chemistry for GCSE/IGCSE - Class 10
Description
Full syllabus notes, lecture & questions for Graph Interpretation for Rate of a Reaction | Chemistry for GCSE/IGCSE - Class 10 - Class 10 | Plus excerises question with solution to help you revise complete syllabus for Chemistry for GCSE/IGCSE | Best notes, free PDF download
Information about Graph Interpretation for Rate of a Reaction
In this doc you can find the meaning of Graph Interpretation for Rate of a Reaction defined & explained in the simplest way possible. Besides explaining types of
Graph Interpretation for Rate of a Reaction theory, EduRev gives you an ample number of questions to practice Graph Interpretation for Rate of a Reaction tests, examples and also practice Class 10
tests

Related Searches
shortcuts and tricks
,Important questions
,Graph Interpretation for Rate of a Reaction | Chemistry for GCSE/IGCSE - Class 10
,study material
,video lectures
,Graph Interpretation for Rate of a Reaction | Chemistry for GCSE/IGCSE - Class 10
,Viva Questions
,mock tests for examination
,Graph Interpretation for Rate of a Reaction | Chemistry for GCSE/IGCSE - Class 10
,Extra Questions
,Objective type Questions
,ppt
,Free
,Previous Year Questions with Solutions
,past year papers
,Exam
,Sample Paper
,practice quizzes
,MCQs
,Summary
,Semester Notes
;


Additional Information about Graph Interpretation for Rate of a Reaction for Class 10 Preparation
Graph Interpretation for Rate of a Reaction Free PDF Download
The Graph Interpretation for Rate of a Reaction is an invaluable resource that delves deep into the core of the Class 10 exam.
These study notes are curated by experts and cover all the essential topics and concepts, making your preparation more efficient and effective.
With the help of these notes, you can grasp complex subjects quickly, revise important points easily,
and reinforce your understanding of key concepts. The study notes are presented in a concise and easy-to-understand manner,
allowing you to optimize your learning process. Whether you're looking for best-recommended books, sample papers, study material,
or toppers' notes, this PDF has got you covered. Download the Graph Interpretation for Rate of a Reaction now and kickstart your journey towards success in the Class 10 exam.
Importance of Graph Interpretation for Rate of a Reaction
The importance of Graph Interpretation for Rate of a Reaction cannot be overstated, especially for Class 10 aspirants.
This document holds the key to success in the Class 10 exam.
It offers a detailed understanding of the concept, providing invaluable insights into the topic.
By knowing the concepts well in advance, students can plan their preparation effectively.
Utilize this indispensable guide for a well-rounded preparation and achieve your desired results.
Graph Interpretation for Rate of a Reaction Notes
Graph Interpretation for Rate of a Reaction Notes offer in-depth insights into the specific topic to help you master it with ease.
This comprehensive document covers all aspects related to Graph Interpretation for Rate of a Reaction.
It includes detailed information about the exam syllabus, recommended books, and study materials for a well-rounded preparation.
Practice papers and question papers enable you to assess your progress effectively.
Additionally, the paper analysis provides valuable tips for tackling the exam strategically.
Access to Toppers' notes gives you an edge in understanding complex concepts.
Whether you're a beginner or aiming for advanced proficiency, Graph Interpretation for Rate of a Reaction Notes on EduRev are your ultimate resource for success.
Graph Interpretation for Rate of a Reaction Class 10 Questions
The "Graph Interpretation for Rate of a Reaction Class 10 Questions" guide is a valuable resource for all aspiring students preparing for the
Class 10 exam. It focuses on providing a wide range of practice questions to help students gauge
their understanding of the exam topics. These questions cover the entire syllabus, ensuring comprehensive preparation.
The guide includes previous years' question papers for students to familiarize themselves with the exam's format and difficulty level.
Additionally, it offers subject-specific question banks, allowing students to focus on weak areas and improve their performance.
Study Graph Interpretation for Rate of a Reaction on the App
Students of Class 10 can study Graph Interpretation for Rate of a Reaction alongwith tests & analysis from the EduRev app,
which will help them while preparing for their exam. Apart from the Graph Interpretation for Rate of a Reaction,
students can also utilize the EduRev App for other study materials such as previous year question papers, syllabus, important questions, etc.
The EduRev App will make your learning easier as you can access it from anywhere you want.
The content of Graph Interpretation for Rate of a Reaction is prepared as per the latest Class 10 syllabus.
|
© EduRev
|
Education Revolution
|


|


Signup to see your scores
go up within 7 days!
Access 1000+ FREE Docs, Videos and Tests
Takes less than 10 seconds to signup