Class 10 Exam > Class 10 Notes > Geography for GCSE/IGCSE > Weather Data
Weather Data | Geography for GCSE/IGCSE - Class 10 PDF Download

Calculations using Weather Data
Rainfall
- Rainfall totals are recorded daily, weekly, monthly, and annually.
- Measurement is standardized in millimeters (mm).
- Data is typically visualized on a bar graph.
- Mean monthly and annual rainfall averages are calculated over at least 30 years.
Describing Annual Rainfall Amounts: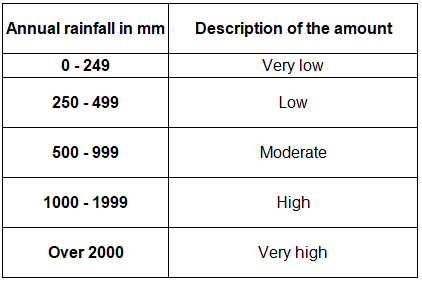
Temperature
- Measured in °C or °F
- Always plotted as a line graph
- Calculations are:
- Diurnal (daily)
- Mean daily temperature
- Mean monthly temperature
- Annual range
- Mean annual range
Describing Temperatures: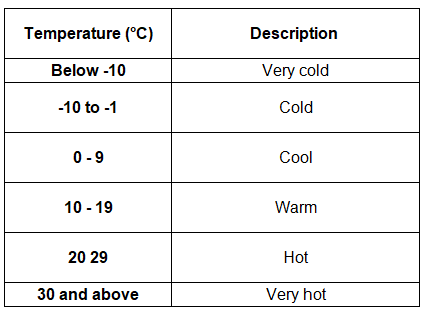 Describing Temperature Ranges:
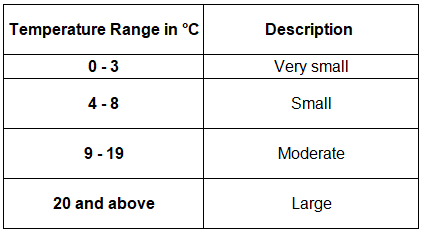
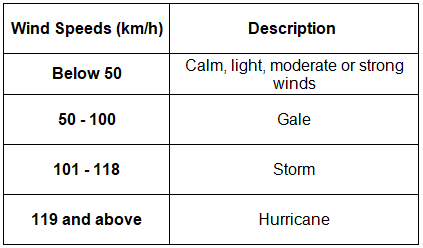
Wind
- Temperature is measured in different units like Knots (Kts), Miles per hour (mph), and Kilometres per hour (km/h).
- Wind direction is indicated from where it is coming using compass points, providing insights into temperature and moisture levels.
- The prevailing wind, like the southwest wind in the UK, is the most common wind direction in a region.
- The dominant wind signifies the strongest wind direction in an area.
- Wind barbs are used to plot wind speed and direction on a map.
Describing Wind Speeds:
Pressure
- Pressure is typically measured in millibars (mb) in relation to the average sea level pressure.
- The mean (average) sea level pressure is commonly at 1013mb.
- Pressure readings are time-dependent, varying based on specific circumstances:
- Following a storm or potential storm, frequent pressure readings, sometimes hourly, are necessary.
- Weekend forecasts generally entail daily pressure measurements.
- For sailing forecasts, an initial morning reading may be required, followed by subsequent updates.
- Isobars on weather charts connect areas with equal sea-level pressures:
- These isobars help identify atmospheric features like anticyclones (high pressure areas) and depressions (low pressure areas).
- Characteristics of high-pressure systems (anticyclones):
- Winds in high-pressure areas are usually gentle and flow clockwise (in the northern hemisphere).
- The descending air suppresses cloud formation, resulting in light winds and stable weather conditions.
- Features of low-pressure systems (depressions):
- Air in low-pressure areas ascends and moves counterclockwise around the center (in the northern hemisphere).
- As the rising air cools, water vapor condenses to form clouds and possibly precipitation.
- Depressions often bring unsettled weather with associated weather fronts.
- High-pressure systems are termed as such even if they do not reach 1013mb, surrounded by lower pressures.
- Conversely, low-pressure areas can have central pressure exceeding 1013mb, enclosed by higher pressures.
Describing Pressure Systems: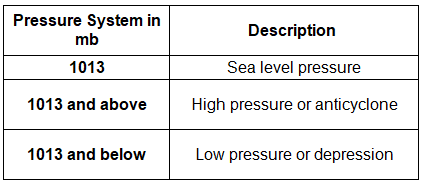
Relative Humidity
Relative humidity is a measure of the moisture content in the air in relation to the maximum amount of moisture that air can hold at a specific temperature.
- It is determined by observing where the depression of the wet bulb thermometer intersects with the dry bulb temperature line.
- Humidity is expressed as a percentage of the air's temperature.
- Temperature influences relative humidity; warmer air can hold more water vapor.
- For instance, at 20°C, air holding 4 grams of water has a relative humidity of 27%. If more water is added, the humidity increases until saturation is reached.
- When the temperature rises, air can hold more water, causing relative humidity to decrease. Conversely, as temperatures drop, excess water is released until equilibrium is achieved.
Question for Weather DataTry yourself: What is the unit of measurement for rainfall?View Solution
The document Weather Data | Geography for GCSE/IGCSE - Class 10 is a part of the Class 10 Course Geography for GCSE/IGCSE.
All you need of Class 10 at this link: Class 10
|
55 videos|68 docs|78 tests
|
FAQs on Weather Data - Geography for GCSE/IGCSE - Class 10
| 1. What is the relationship between pressure and relative humidity in weather data calculations? |  |
Ans. Pressure and relative humidity have an inverse relationship in weather data calculations. As pressure increases, relative humidity decreases, and vice versa.
| 2. How does pressure affect weather conditions? | |
Ans. Pressure plays a significant role in determining weather conditions. High pressure usually brings clear skies and stable weather, while low pressure typically results in cloudy, rainy, or stormy conditions.
| 3. Why is it important to consider both pressure and relative humidity in weather data analysis? | |
Ans. Both pressure and relative humidity provide valuable information about the current and future weather conditions. By analyzing both factors, meteorologists can make more accurate forecasts and predictions.
| 4. How can changes in pressure and relative humidity impact daily weather patterns? | |
Ans. Changes in pressure and relative humidity can lead to shifts in weather patterns. For example, a decrease in pressure combined with high relative humidity may indicate the approach of a storm or precipitation.
| 5. What units are typically used to measure pressure and relative humidity in weather data calculations? | |
Ans. Pressure is often measured in millibars or inches of mercury, while relative humidity is expressed as a percentage. These units are commonly used in weather data analysis and forecasting.
About this Document

Oct 24, 2025
Last updated
Related Exams
Document Description: Weather Data for Class 10 2025 is part of Geography for GCSE/IGCSE preparation.
The notes and questions for Weather Data have been prepared according to the Class 10 exam syllabus. Information about Weather Data covers topics
like Calculations using Weather Data, Pressure, Relative Humidity and Weather Data Example, for Class 10 2025 Exam. Find important definitions, questions, notes, meanings, examples, exercises and tests below for Weather Data.
Introduction of Weather Data in English is available as part of our Geography for GCSE/IGCSE
for Class 10 & Weather Data in Hindi for Geography for GCSE/IGCSE course.
Download more important topics related with notes, lectures and mock test series for Class 10
Exam by signing up for free. Class 10: Weather Data | Geography for GCSE/IGCSE - Class 10
Description
Full syllabus notes, lecture & questions for Weather Data | Geography for GCSE/IGCSE - Class 10 - Class 10 | Plus excerises question with solution to help you revise complete syllabus for Geography for GCSE/IGCSE | Best notes, free PDF download
Information about Weather Data
In this doc you can find the meaning of Weather Data defined & explained in the simplest way possible. Besides explaining types of
Weather Data theory, EduRev gives you an ample number of questions to practice Weather Data tests, examples and also practice Class 10
tests

Related Searches
study material
,Objective type Questions
,shortcuts and tricks
,Previous Year Questions with Solutions
,Extra Questions
,Semester Notes
,Free
,Weather Data | Geography for GCSE/IGCSE - Class 10
,MCQs
,Exam
,Important questions
,past year papers
,mock tests for examination
,Summary
,ppt
,video lectures
,Weather Data | Geography for GCSE/IGCSE - Class 10
,Viva Questions
,Sample Paper
,Weather Data | Geography for GCSE/IGCSE - Class 10
,practice quizzes
;


Additional Information about Weather Data for Class 10 Preparation
Weather Data Free PDF Download
The Weather Data is an invaluable resource that delves deep into the core of the Class 10 exam.
These study notes are curated by experts and cover all the essential topics and concepts, making your preparation more efficient and effective.
With the help of these notes, you can grasp complex subjects quickly, revise important points easily,
and reinforce your understanding of key concepts. The study notes are presented in a concise and easy-to-understand manner,
allowing you to optimize your learning process. Whether you're looking for best-recommended books, sample papers, study material,
or toppers' notes, this PDF has got you covered. Download the Weather Data now and kickstart your journey towards success in the Class 10 exam.
Importance of Weather Data
The importance of Weather Data cannot be overstated, especially for Class 10 aspirants.
This document holds the key to success in the Class 10 exam.
It offers a detailed understanding of the concept, providing invaluable insights into the topic.
By knowing the concepts well in advance, students can plan their preparation effectively.
Utilize this indispensable guide for a well-rounded preparation and achieve your desired results.
Weather Data Notes
Weather Data Notes offer in-depth insights into the specific topic to help you master it with ease.
This comprehensive document covers all aspects related to Weather Data.
It includes detailed information about the exam syllabus, recommended books, and study materials for a well-rounded preparation.
Practice papers and question papers enable you to assess your progress effectively.
Additionally, the paper analysis provides valuable tips for tackling the exam strategically.
Access to Toppers' notes gives you an edge in understanding complex concepts.
Whether you're a beginner or aiming for advanced proficiency, Weather Data Notes on EduRev are your ultimate resource for success.
Weather Data Class 10 Questions
The "Weather Data Class 10 Questions" guide is a valuable resource for all aspiring students preparing for the
Class 10 exam. It focuses on providing a wide range of practice questions to help students gauge
their understanding of the exam topics. These questions cover the entire syllabus, ensuring comprehensive preparation.
The guide includes previous years' question papers for students to familiarize themselves with the exam's format and difficulty level.
Additionally, it offers subject-specific question banks, allowing students to focus on weak areas and improve their performance.
Study Weather Data on the App
Students of Class 10 can study Weather Data alongwith tests & analysis from the EduRev app,
which will help them while preparing for their exam. Apart from the Weather Data,
students can also utilize the EduRev App for other study materials such as previous year question papers, syllabus, important questions, etc.
The EduRev App will make your learning easier as you can access it from anywhere you want.
The content of Weather Data is prepared as per the latest Class 10 syllabus.
|
© EduRev
|
Education Revolution
|


|


Signup to see your scores
go up within 7 days!
Access 1000+ FREE Docs, Videos and Tests
Takes less than 10 seconds to signup