Class 10 Exam > Class 10 Notes > Geography for GCSE/IGCSE > Weather Data Interpretation
Weather Data Interpretation | Geography for GCSE/IGCSE - Class 10 PDF Download
| Table of contents |

|
| Climate graphs |

|
| Dispersion Graphs |

|
| Wind rose |

|
| Wind barbs |

|
| Isoline and choropleth maps |

|
| Synoptic Charts |

|
Climate graphs
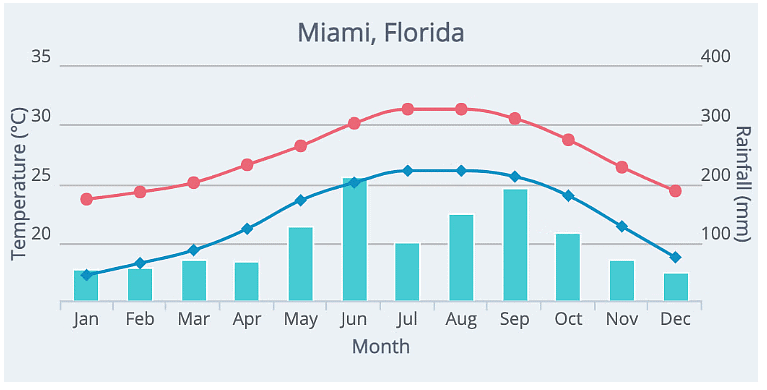
- Climate graphs depict average monthly temperatures and precipitation levels spanning a 30-year period.
- They can represent local, national, or global climates.
- Precipitation is typically displayed as a bar graph, while temperature is depicted as a line graph.
- The graph's overall shape is analyzed, observing whether the temperature line is steep or gradual and noting any seasonal variations.
- Extremes in temperature and rainfall are identified, along with the corresponding months.
- Anomalies, deviations from the expected trends, are noted.
- Seasons with the highest and lowest rainfall are determined, considering regional variations and hemisphere differences.
- Temperature range is calculated by subtracting the lowest temperature from the highest.
- Total annual rainfall is calculated by summing the monthly rainfall totals and dividing by 12 to find the average monthly rainfall.
Dispersion Graphs
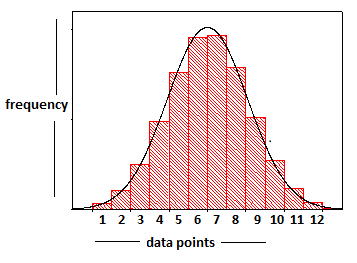
- Dispersion graphs are valuable for comparing sets of data.
- They illustrate whether data clusters together or is widely spread out.
- Data points are plotted on the vertical axis.
- Dispersion graphs can showcase upper and lower values, as well as statistical measures like mean, median, mode, and extremes.
- When analyzing a dispersion graph, remember to:
- Read the title to understand the graph's purpose.
- Grasp the meaning of each axis.
- Describe the overall pattern depicted.
- Identify any irregularities or outliers in the data.
- Perform statistical analyses such as calculating the mean, median, and range, if necessary.
Question for Weather Data InterpretationTry yourself: What do climate graphs depict?View Solution
Wind rose
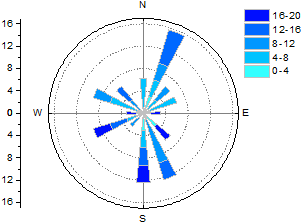
- The direction of wind for a specific place is shown on a wind rose
- Made of circles that radiate rectangles representing points of a compass
- Lengths of the rectangles show the number of days or time that the wind blew from that direction
- The number of days or hours when there is zero wind is shown in the center of the rose
Wind barbs
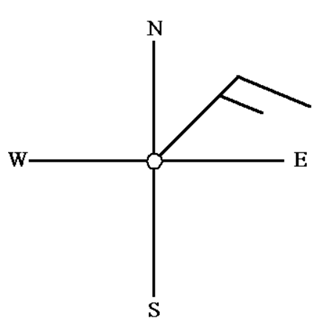
- When interpreting a weather map, wind direction and intensity are depicted through wind barbs.
- Wind barbs indicate the direction from which the wind is blowing.
- The arrowhead on a wind barb points in the direction the wind is moving towards.
- On the map, half barbs signify 5 knots, full barbs represent 10 knots, and flags symbolize 50 knots of wind speed.
- A combination of these symbols provides the overall wind speed and its originating direction. For instance, a double flag suggests 100 knots, while a double flag with 3 full barbs and a half barb indicates 135 knots.
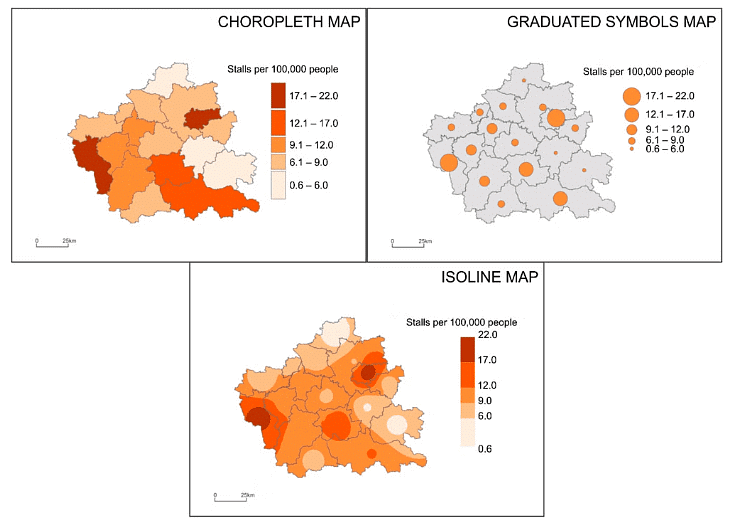
Isoline and choropleth maps
- Isohyets: Lines connecting areas with the same rainfall levels.
- Isotherms: Connect points with the same temperature.
- Isobars: Link locations with identical atmospheric pressure.
- Isoline Maps: These become choropleth isoline maps when shaded between the lines, with shading progressing from light to dark, the darkest shade indicating the highest value.
Synoptic Charts
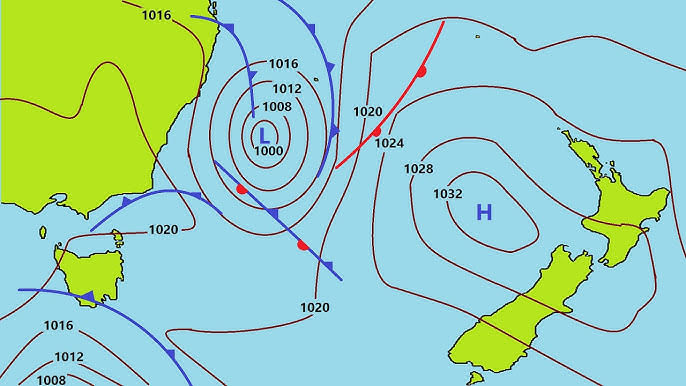
- Meteorological station readings are depicted on synoptic charts.
- These readings can display various meteorological parameters such as:
- Wind speed
- Wind direction
- Pressure patterns
- Weather fronts
- Cloud cover
- Temperatures
Question for Weather Data InterpretationTry yourself: What do wind barbs on a weather map indicate?View Solution
The document Weather Data Interpretation | Geography for GCSE/IGCSE - Class 10 is a part of the Class 10 Course Geography for GCSE/IGCSE.
All you need of Class 10 at this link: Class 10
|
55 videos|68 docs|78 tests
|
FAQs on Weather Data Interpretation - Geography for GCSE/IGCSE - Class 10
| 1. How can weather data be interpreted for analysis? |  |
Ans. Weather data can be interpreted by analyzing trends in temperature, understanding climate anomalies, studying seasons in different hemispheres, interpreting weather maps and symbols, and examining shading on synoptic charts.
| 2. What are some key aspects to consider when analyzing temperature trends? |  |
Ans. When analyzing temperature trends, it is important to consider the variation in temperature over time, the average temperature for a specific period, the difference between day and night temperatures, and any anomalies or unusual patterns in the data.
| 3. How can climate anomalies impact weather data interpretation? |  |
Ans. Climate anomalies, such as extreme weather events or abnormal temperature fluctuations, can significantly impact weather data interpretation by skewing the overall trends and patterns. It is important to identify and account for these anomalies when analyzing weather data.
| 4. How do seasons in different hemispheres affect weather data interpretation? |  |
Ans. Seasons in different hemispheres can lead to varying weather patterns and temperature trends. Understanding the seasonal differences between hemispheres is crucial for accurate weather data interpretation and forecasting.
| 5. What role do weather map symbols play in interpreting weather data? |  |
Ans. Weather map symbols provide important information about weather conditions, such as temperature, pressure systems, and precipitation. Understanding these symbols is essential for interpreting weather data accurately and making informed predictions.
Related Searches


