Year 11 Exam > Year 11 Notes > Business Studies for GCSE/IGCSE > Presenting & Using Market Research Data
Presenting & Using Market Research Data | Business Studies for GCSE/IGCSE - Year 11 PDF Download
Presenting Market Research Data
- Market research data must be transformed into easily understandable formats that can support business decision-making.
- Typical methods for presenting data include tally charts, bar charts, pie graphs, and scatter graphs.
Tally charts
- A table or tally chart serves as a straightforward technique to document data in its original state.
- It proves especially handy for capturing the frequency of an event as it unfolds.
- For instance, imagine using it to track the number of customers entering a retail store.
- It proves especially handy for capturing the frequency of an event as it unfolds.
- Each occurrence is marked by a small vertical line, with groups of five events represented by four vertical lines and a diagonal line.
- Adding up these groups of five allows for a quick tally to determine frequency.
- Often, data from tally charts is transformed into charts or graphs to enhance visual appeal.
Graphs and charts
- Graphs and charts are often preferred for their visual clarity, making information easier to comprehend.
- The format of presentation is influenced by the nature of the collected data and its intended purpose.
- Quantitative data is typically suited for graphical representation.
- In contrast, qualitative data may be more effectively communicated through written reports.
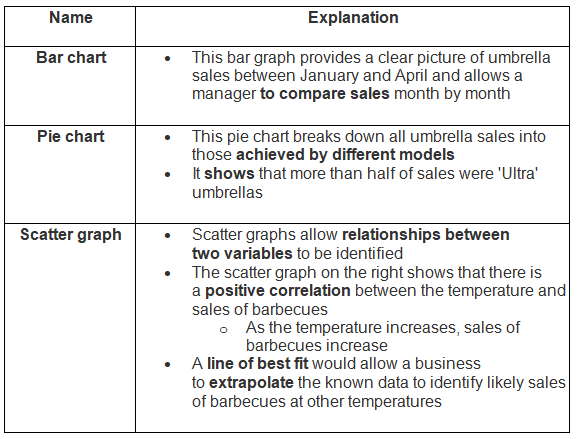
Types of Graphs and Charts

Analysing Market Research Data
- Quantitative Data: Statistical numeric data that aids decision-making processes. It must be accurate and correctly interpreted to be valuable. This data can be sourced from primary or secondary sources, such as financial reports, survey findings, marketing or sales data, and statistical research from government or research organizations.
- Qualitative Data: Requires skill and insight for appropriate interpretation. It involves drawing conclusions from opinions, insights, feelings, and preferences. Collected mainly from primary sources like focus groups, detailed surveys/interviews, and test marketing.
- Utilization of Data: Both quantitative and qualitative data assist business managers in sales forecasting, trend identification, and decision-making regarding product development, promotional planning, pricing strategies, and other crucial elements of the marketing mix.
Question for Presenting & Using Market Research DataTry yourself: Which method of presenting data is most suitable for capturing the frequency of an event as it unfolds?View Solution
The document Presenting & Using Market Research Data | Business Studies for GCSE/IGCSE - Year 11 is a part of the Year 11 Course Business Studies for GCSE/IGCSE.
All you need of Year 11 at this link: Year 11
|
70 videos|94 docs|25 tests
|
FAQs on Presenting & Using Market Research Data - Business Studies for GCSE/IGCSE - Year 11
| 1. What are some common methods for presenting market research data? |  |
Ans. Some common methods for presenting market research data include graphs, charts, tables, and infographics. These visual representations help to communicate complex data in a clear and easily understandable way.
| 2. How can market research data be analyzed effectively? |  |
Ans. Market research data can be analyzed effectively by using statistical analysis tools, conducting surveys and interviews, and identifying key trends and patterns within the data. This analysis helps to draw meaningful insights and make informed decisions.
| 3. Why is it important to present and use market research data in decision-making processes? |  |
Ans. Presenting and using market research data in decision-making processes is important because it helps businesses to understand their target market, identify opportunities for growth, and make informed decisions based on data-driven insights. This ultimately leads to more successful and strategic business outcomes.
| 4. What are some key benefits of using market research data in business strategies? |  |
Ans. Some key benefits of using market research data in business strategies include improved understanding of customer needs and preferences, better targeting of marketing efforts, identification of market trends, and competitive analysis. This data-driven approach can lead to increased profitability and market success.
| 5. How can businesses ensure that the market research data they collect is accurate and reliable? |  |
Ans. Businesses can ensure that the market research data they collect is accurate and reliable by using reputable research methods, ensuring data quality control, and validating findings through multiple sources. It is also important to regularly update and review data to ensure its relevance and accuracy.
Related Searches


