Class 10 Exam > Class 10 Notes > Business Studies for GCSE/IGCSE > Break-even Charts
Break-even Charts | Business Studies for GCSE/IGCSE - Class 10 PDF Download
An Introduction to Break-even
- Break-even analysis is a financial tool that helps businesses determine the number of units they need to sell to reach a point where their revenue equals expenses, resulting in neither profit nor loss.
- It assists businesses in understanding the minimum sales level required to cover all costs, enabling informed decisions on pricing and production volumes.
- By identifying the break-even point, which is the sales volume needed for total costs to match sales revenue, managers can make strategic decisions.
Elements of a Break-even Analysis
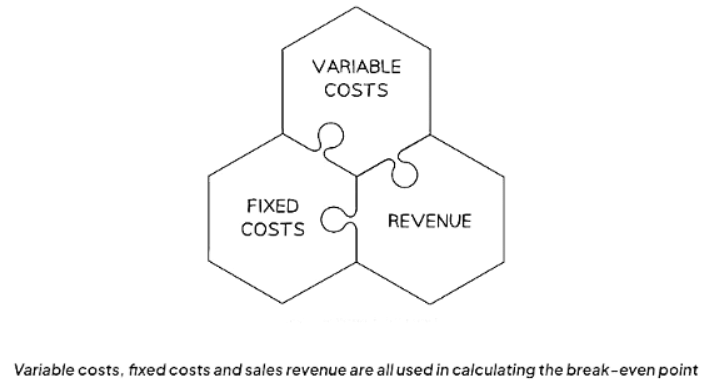
- Fixed costs remain constant irrespective of production levels, such as rent, salaries, and insurance expenses.
- Variable costs fluctuate based on production or sales levels, including expenses like raw materials, direct labor, packaging, and shipping.
- Sales revenue represents the income generated from product or service sales, calculated as the number of items sold multiplied by the selling price.
Constructing a Break-even Chart
- Break-even charts are graphical representations illustrating how costs and revenues of a business alter with sales. They pinpoint the specific number of units a business needs to sell to reach the break-even point.
- To create a break-even chart, a business must have a grasp of its estimated fixed costs, variable costs, and sales revenue.
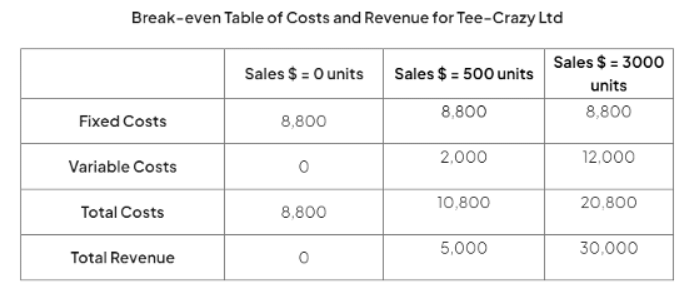
- Tee Crazy Ltd has the following estimates
- Fixed costs estimation: Tee Crazy Ltd has fixed costs amounting to $8,800 annually.
- Variable costs breakdown: The variable cost associated with each t-shirt is $4.
- Pricing strategy: Each t-shirt is retailed at $10.
- Production capacity: Tee Crazy Ltd can manufacture a maximum of 3000 t-shirts per year.
Question for Break-even ChartsTry yourself: What is break-even analysis?View Solution
Diagrams for Constructing a Break-even Chart
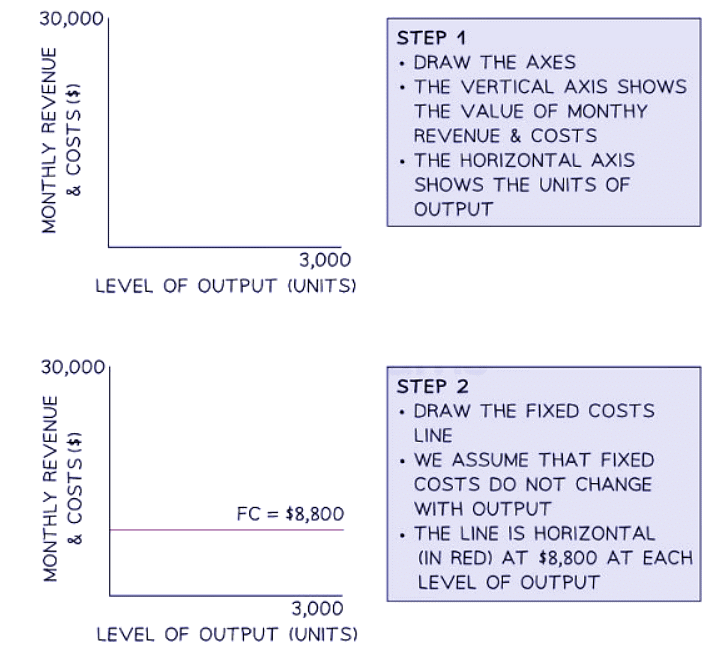
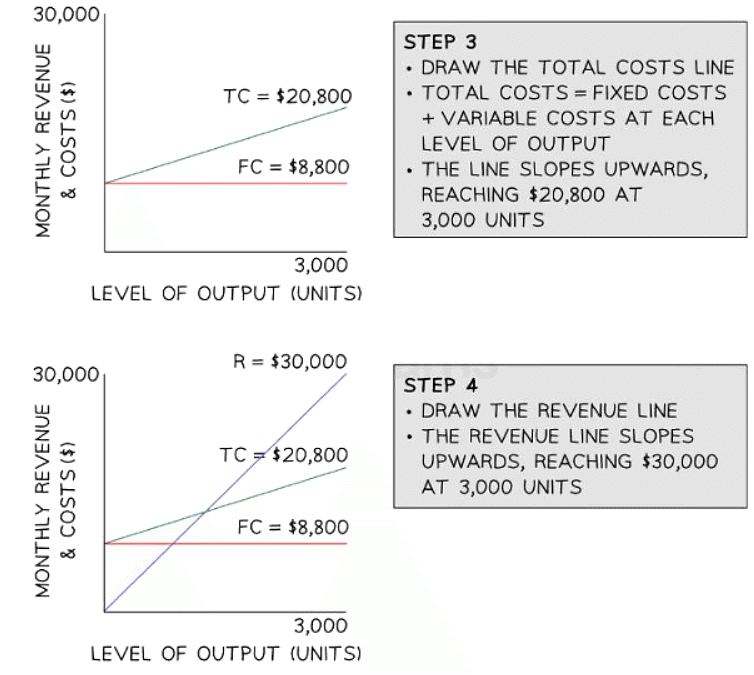
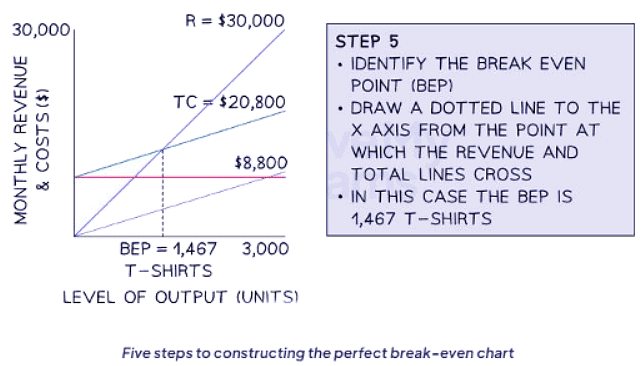
- When production output is below the break-even point, the business incurs a loss.
- Production output surpassing the break-even point leads to a profit.
Interpreting a Break-even Chart
A break-even chart provides a visual representation of the break-even point, highlighting key metrics such as:
- The break-even point
- The margin of safety
- The expected profit or loss
Diagram of a Break-even Chart
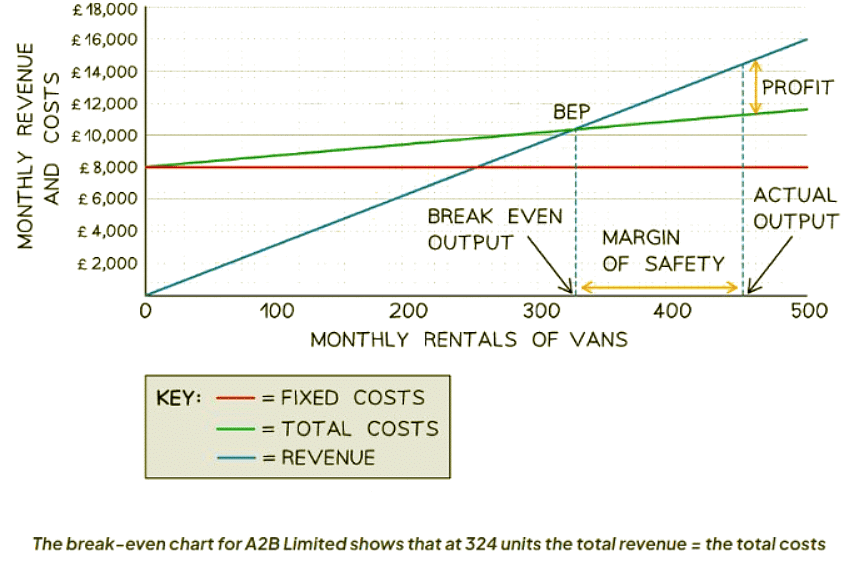
Diagram Analysis
Understanding Fixed and Variable Costs
- Fixed costs remain constant regardless of output levels
- A2B's fixed costs amount to £8,000, unchanged whether producing 0 or 500 units
Breakdown of Total Costs
- Total costs comprise fixed and variable expenses
- At 0 units, costs solely consist of fixed expenses
- By 500 units, total variable costs reach £11,800, increasing with output
Understanding Revenue Generation
- Revenue increases with output volume
- At 0 units, revenue is £0, but at 500 units, it totals £11,800
- Revenue growth outpaces total costs, leading to profit
Interpreting Key Points
- The break-even point is where revenue equals total costs
- A2B's break-even level is at 324 units
- Margin of safety is the difference between actual and break-even output
- Profit at a given output level is revenue minus total costs
Revenue and Cost Analysis:
- At zero units of output, the revenue is zero.
- When the output reaches 500 units, the total revenue amounts to £11,800.
- Revenue tends to rise as the output increases.
- The revenue line has a steeper slope compared to the total costs line, intersecting it at a certain point.
Break Even Point:
- The break-even point is where the total costs and revenue lines intersect.
- For company A2B, the break-even output level is 324 units.
Margin of Safety:
- The margin of safety is the gap on the x-axis between the actual output level (e.g., 450 units) and the break-even point (300 units), which, in this case, equals 150 units.
Profit Calculation:
- Profit at a specific output level is the difference between the revenue and total costs. For instance, at 450 units of output, the profit is £3,150 (£14,400 - £11,250).
The document Break-even Charts | Business Studies for GCSE/IGCSE - Class 10 is a part of the Class 10 Course Business Studies for GCSE/IGCSE.
All you need of Class 10 at this link: Class 10
|
70 videos|93 docs|26 tests
|
FAQs on Break-even Charts - Business Studies for GCSE/IGCSE - Class 10
| 1. What is a break-even chart and how is it constructed? |  |
Ans. A break-even chart is a graphical representation of the point at which total revenue equals total costs. It is constructed by plotting a company's fixed costs, variable costs, total costs, and total revenue on a graph to determine the break-even point.
| 2. How can a break-even chart be interpreted? |  |
Ans. A break-even chart can be interpreted by looking at the point where the total revenue line intersects the total cost line, which represents the break-even point. This point indicates the level of sales at which a company neither makes a profit nor incurs a loss.
| 3. What are fixed and variable costs in relation to break-even analysis? |  |
Ans. Fixed costs are expenses that remain constant regardless of the level of production or sales, such as rent or salaries. Variable costs, on the other hand, fluctuate based on the level of production or sales, such as raw materials or labor costs.
| 4. How do fixed and variable costs impact a company's break-even point? |  |
Ans. Fixed costs impact the break-even point by setting a baseline that must be covered before a company can start making a profit. Variable costs affect the break-even point by influencing the amount of revenue needed to cover these costs and start generating a profit.
| 5. How can break-even analysis help businesses make strategic decisions? |  |
Ans. Break-even analysis can help businesses determine the minimum level of sales needed to cover costs and make a profit. This information can be used to set pricing strategies, determine production levels, and assess the feasibility of new projects or initiatives.
Related Searches


