Smart Charts Chapter Notes | Mathematics for Class 4: NCERT PDF Download
| Table of contents |

|
| Introduction |

|
| How many hours? |

|
| Food We Eat |

|
| Preparing for class Drama |

|
| Chapati Chart |

|
| Getting Wet in the rain |

|
| Tea Coffee Milk |

|
Introduction
Get ready to embark on an exciting journey into the world of Smart Charts! Today, we're diving into the realm of data visualization, where we'll learn how to turn numbers and information into colorful, easy-to-understand charts and graphs. Smart Charts are powerful tools that help us organize, analyze, and present data in a visually appealing way. In this lesson, we'll explore different types of charts, such as bar graphs, line graphs, and pie charts, and discover how each one can help us convey information effectively. So, sharpen your pencils and get ready to unleash your creativity as we dive into the world of Smart Charts!"
How many hours?
How much time do we spend in this? Note the time you spend in front of a TV or radio every day. Do this for one week. The time spent in a week is _________ hours. So in a month you spend about 30 × ___ = _____ hours. Find out from your friends the time they spend in a week
By this Way you would be able to collect Data.
Food We Eat

By this You can Easily collect data related to How Much one consume."To collect data on what we eat, simply jot down each meal and snack, noting the type of food, portion size, and any relevant details. This helps us track our eating habits, make healthier choices, and improve our overall well-being."
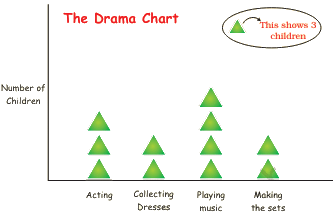
Preparing for class Drama
A visual representation uses rectangular bars to show different categories of information. The length of each bar reflects its value, making it simple to compare between categories."
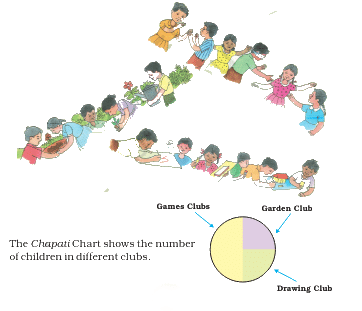
Chapati Chart
"A chapati chart is like a round chapati divided into slices, where each slice represents different categories of information. The size of each slice shows how much of the whole it represents, helping us understand data quickly and easily."
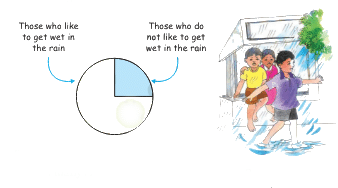
Getting Wet in the rain
"Imagine if there are 15 people who enjoy the rain and 25 people who prefer sunny days. This illustrates that people have different preferences when it comes to weather. Some may find joy and comfort in the sound of raindrops and the smell of wet earth, while others prefer the warmth and brightness of sunshine. Recognizing these diverse preferences helps us appreciate the uniqueness of individuals and their experiences."
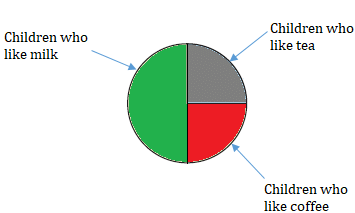
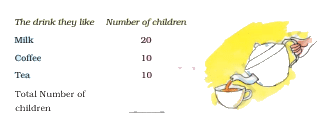
Tea Coffee Milk
"Imagine if there are 10 people who enjoy drinking tea and 20 people who prefer coffee. This shows that different people have different preferences when it comes to beverages. Some may like the warmth and aroma of tea, while others enjoy the bold flavor of coffee. Understanding people's preferences helps us appreciate the diversity of tastes and choices in our community."
|
26 videos|195 docs|34 tests
|


