Year 7 Exam > Year 7 Notes > How to draw direct and inverse proportion graphs
How to draw direct and inverse proportion graphs - Year 7 PDF Download
| Table of contents |
|
| Introduction |
|
| How to Recognize Whether Graphs Show Direct or Inverse Proportion |
|
| How to Create a Direct Proportion Graph with Real-Life Data |
|
| How to draw a graph for inverse proportion |
|

Introduction
- Direct proportion is where variables change in the same direction and by the same proportion. As one variable increases or decreases, so does the other at the same rate. For example, if one variable is multiplied by 10, the other is also multiplied by 10, and if one is halved, the other is also halved. The ratio x/y remains constant.
- The notation and general equation for y being directly proportional to x is y ∝ x.
- A graph of direct proportion is a straight line passing through the origin (0, 0). When x = 0, y = 0.
- Inverse proportion graphs use the notation and equation
 The product of the two variables, x and y, remains constant. For example, if x = 20 and y = 4, then x × y = 20 × 4 = 80. If x = 20, then y = 1.
 - A graph showing inverse proportion is a curve that approaches the axes as x and y reach extreme values. As one variable increases, the other decreases at the same rate. For example, if one variable is multiplied by 10, the other is divided by 10, and if one is halved, the other is doubled.
- Graphs are plotted using pairs of values, called coordinates. A direct proportional graph can be drawn by plotting three points, while an inverse proportional graph needs more points for an accurate curve.
How to Recognize Whether Graphs Show Direct or Inverse Proportion
- If a graph demonstrates direct proportion:
- The graph appears as a straight line.
- The line passes through the origin (0, 0).
- For any coordinate (x, y), the ratio x : y remains constant.
- The equation of the line follows the general form y = nx.
- If a graph illustrates inverse proportion:
- The graph forms a curve.
- The curve does not intersect either axis.
- For any coordinate (x,y), the product of x and y remains constant (xy = k).
- The equation of the curve follows the general form y = k/x for each coordinate.
Example
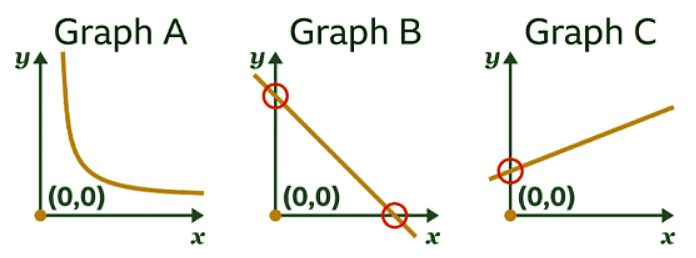
Example: Explain why none of these graphs shows direct proportion.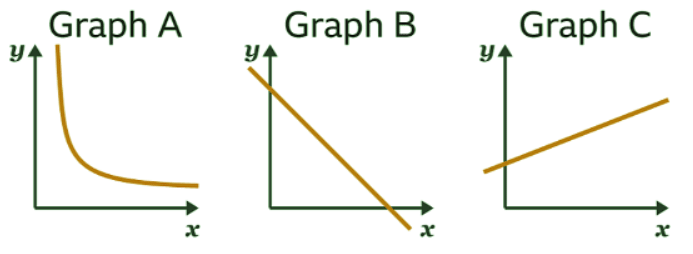 Sol: A graph shows direct proportion when the graph is a straight line, and the line goes through the origin (0, 0).
- Graph A is not a straight line, so does not show direct proportion.
- Graph B is a straight line, however the line does not pass through the origin (0, 0), so the graph does not show direct proportion.
- Graph C is a straight line, however the line does not pass through the origin (0, 0), so the graph does not show direct proportion.
How to Create a Direct Proportion Graph with Real-Life Data
To sketch a direct proportion graph:
- Identify the relationship between the variables (x:y).
- Create a table of values using this ratio. Start with (0, 0) and use the given ratio to determine additional points. You need at least three coordinates for plotting.
- The initial point is always (0, 0).
- Another point repeats the specified ratio.
- Multiply to derive at least one more coordinate.
- At least three coordinates are necessary, although more can be included.
- Plot the identified coordinates.
- Draw a straight line passing through these points and the origin (0, 0).
Example
Example: Given that 5 miles are approximately 8 kilometres, draw a graph of distance in miles (𝒙) against distance in kilometres (𝒚) to show the directly proportional relationship. Sol:
Sol: 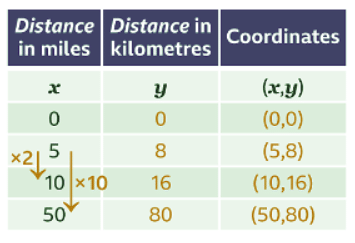
- The distance in miles and the distance in kilometres are directly proportional. The ratio of miles : kilometres is always 5 : 8. A distance of zero in miles is zero in kilometres. This gives the point (0, 0). The given fact that 5 miles ≈ 8 kilometres gives the point (5, 8). These values can be multiplied to give other coordinates. For example, doubling the coordinate (5, 8) gives (10, 16). Multiplying the coordinate (5, 8) by ten gives (50, 80).
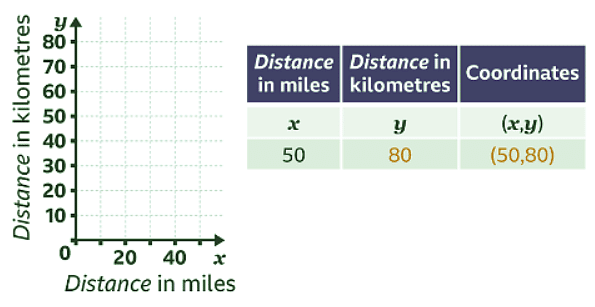
- The greatest number of miles is 50 miles. The 𝒙-axis (horizontal axis) should go up to 50. The greatest number of kilometres is 80. The 𝒚-axis (vertical axis) should go up to 80
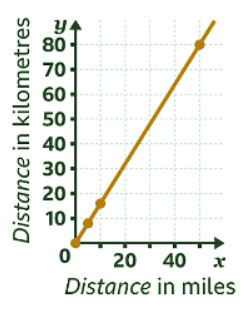
- The points are plotted. The points are all in a straight line. Join the points to complete the graph. Values may be read from the graph when converting between miles and kilometres.
How to draw a graph for inverse proportion
To draw a graph for inverse proportion:
- Identify the constant product of the variables (x): When dealing with inverse proportion, it's crucial to first recognize the constant product of the variables involved. This product remains the same even as the values of the variables change.
- Draw a table of values and find factor pairs: Creating a table of values is essential to visualize the relationship between the variables in inverse proportion. Factor pairs are pairs of numbers that, when multiplied, result in the same product. By identifying these pairs, you can accurately represent the inverse proportion on a graph.
- Each factor pair yields the same product.
- Since the graph is a curve, multiple coordinates are necessary.
- It is essential to plot these coordinates accurately.
- When graphing a rectangle with a fixed area, it is essential to draw a smooth curve through the points.
Example
Example: A rectangle has a fixed area of 24 cm². Draw the graph of the length of the rectangle (𝒙) against its width (𝒚).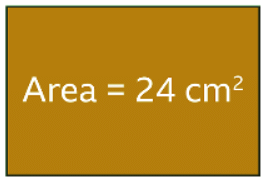 Sol:
Sol: 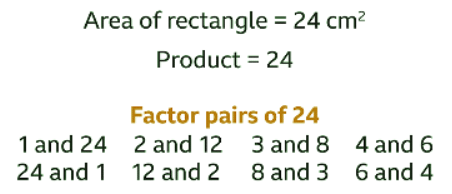
- The area of the rectangle is 24 cm². The product of the length and the width is always 24. List the factor pairs of the product (24) to generate the coordinates. Each factor pair will be used twice.
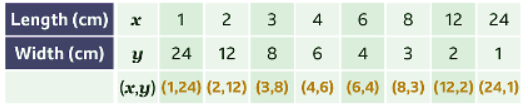
- Draw a table of values. Use the factor pairs of the product (24) to generate the coordinates. Several coordinates are needed because the graph is a curve.
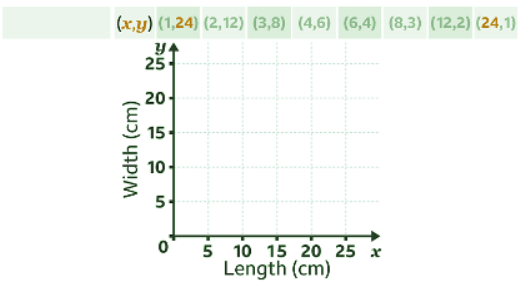
- The largest factor of 24 is 24. The 𝒙- and 𝒚-axes go up to 24
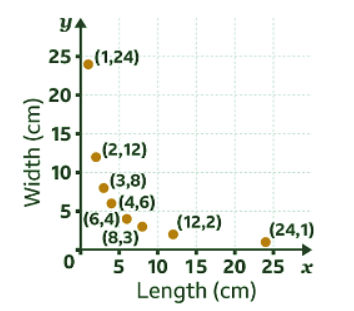
- Plot the coordinates.
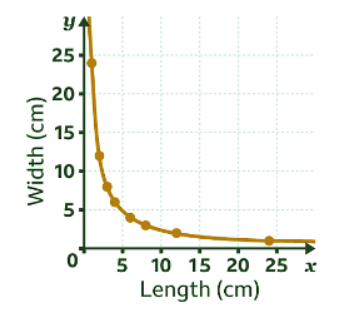
- Draw a smooth curve through the plotted points.
About this Document

Sep 25, 2025
Last updated
Related Exams
Document Description: How to draw direct and inverse proportion graphs for Year 7 2025 is part of Year 7 preparation. The notes and questions for How to draw direct and inverse proportion graphs have been prepared according to the Year 7 exam syllabus. Information about How to draw direct and inverse proportion graphs covers topics like Introduction, How to Recognize Whether Graphs Show Direct or Inverse Proportion, How to Create a Direct Proportion Graph with Real-Life Data, How to draw a graph for inverse proportion and How to draw direct and inverse proportion graphs Example, for Year 7 2025 Exam. Find important definitions, questions, notes, meanings, examples, exercises and tests below for How to draw direct and inverse proportion graphs.
Introduction of How to draw direct and inverse proportion graphs in English is available as part of
our Year 7 preparation & How to draw direct and inverse proportion graphs in Hindi for Year 7
courses. Download more important topics, notes, lectures and mock test series for Year 7
Exam by signing up for free. Year 7: How to draw direct and inverse proportion graphs - Year 7
Description
Full syllabus notes, lecture & questions for How to draw direct and inverse proportion graphs - Year 7 - Year 7 | Plus excerises question with solution to help you revise complete syllabus | Best notes, free PDF download
Information about How to draw direct and inverse proportion graphs
In this doc you can find the meaning of How to draw direct and inverse proportion graphs defined & explained in the simplest way possible.
Besides explaining types of How to draw direct and inverse proportion graphs theory,
EduRev gives you an ample number of questions to practice How to draw direct and inverse proportion graphs tests, examples and also practice Year 7 tests.
Related Searches
Viva Questions
,Objective type Questions
,Sample Paper
,How to draw direct and inverse proportion graphs - Year 7
,study material
,Previous Year Questions with Solutions
,How to draw direct and inverse proportion graphs - Year 7
,How to draw direct and inverse proportion graphs - Year 7
,Important questions
,past year papers
,video lectures
,MCQs
,Free
,Exam
,Semester Notes
,shortcuts and tricks
,Summary
,Extra Questions
,mock tests for examination
,ppt
,practice quizzes
;


Additional Information about How to draw direct and inverse proportion graphs for Year 7 Preparation
How to draw direct and inverse proportion graphs Free PDF Download
The How to draw direct and inverse proportion graphs is an invaluable resource that delves deep into the core of the Year 7 exam.
These study notes are curated by experts and cover all the essential topics and concepts, making your preparation more efficient and effective.
With the help of these notes, you can grasp complex subjects quickly, revise important points easily,
and reinforce your understanding of key concepts. The study notes are presented in a concise and easy-to-understand manner,
allowing you to optimize your learning process. Whether you're looking for best-recommended books, sample papers, study material,
or toppers' notes, this PDF has got you covered. Download the How to draw direct and inverse proportion graphs now and kickstart your journey towards success in the Year 7 exam.
Importance of How to draw direct and inverse proportion graphs
The importance of How to draw direct and inverse proportion graphs cannot be overstated, especially for Year 7 aspirants.
This document holds the key to success in the Year 7 exam.
It offers a detailed understanding of the concept, providing invaluable insights into the topic.
By knowing the concepts well in advance, students can plan their preparation effectively.
Utilize this indispensable guide for a well-rounded preparation and achieve your desired results.
How to draw direct and inverse proportion graphs Notes
How to draw direct and inverse proportion graphs Notes offer in-depth insights into the specific topic to help you master it with ease.
This comprehensive document covers all aspects related to How to draw direct and inverse proportion graphs.
It includes detailed information about the exam syllabus, recommended books, and study materials for a well-rounded preparation.
Practice papers and question papers enable you to assess your progress effectively.
Additionally, the paper analysis provides valuable tips for tackling the exam strategically.
Access to Toppers' notes gives you an edge in understanding complex concepts.
Whether you're a beginner or aiming for advanced proficiency, How to draw direct and inverse proportion graphs Notes on EduRev are your ultimate resource for success.
How to draw direct and inverse proportion graphs Year 7 Questions
The "How to draw direct and inverse proportion graphs Year 7 Questions" guide is a valuable resource for all aspiring students preparing for the
Year 7 exam. It focuses on providing a wide range of practice questions to help students gauge
their understanding of the exam topics. These questions cover the entire syllabus, ensuring comprehensive preparation.
The guide includes previous years' question papers for students to familiarize themselves with the exam's format and difficulty level.
Additionally, it offers subject-specific question banks, allowing students to focus on weak areas and improve their performance.
Study How to draw direct and inverse proportion graphs on the App
Students of Year 7 can study How to draw direct and inverse proportion graphs alongwith tests & analysis from the EduRev app,
which will help them while preparing for their exam. Apart from the How to draw direct and inverse proportion graphs,
students can also utilize the EduRev App for other study materials such as previous year question papers, syllabus, important questions, etc.
The EduRev App will make your learning easier as you can access it from anywhere you want.
The content of How to draw direct and inverse proportion graphs is prepared as per the latest Year 7 syllabus.
|
© EduRev
|
Education Revolution
|


|


Signup to see your scores
go up within 7 days!
Access 1000+ FREE Docs, Videos and Tests
Takes less than 10 seconds to signup