Plotting coordinates in the four quadrants - Year 7 PDF Download
Key points
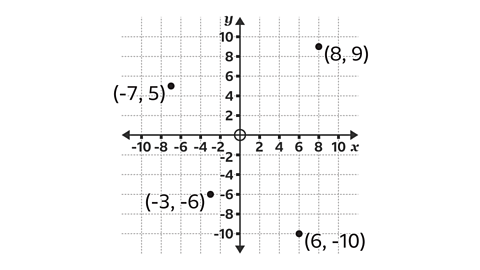 Image caption,
 - Understanding how to plot points in all four quadrants is crucial for drawing linear and quadratic graphs.
- The x-axis is the horizontal line on a graph running left-right through the origin. It provides a reference for measurement.
 The x-axis is the horizontal line on a graph running left-right through the origin. It provides a reference for measurement. The x-axis is the horizontal line on a graph running left-right through the origin. It provides a reference for measurement. The x-axis is the horizontal line on a graph running left-right through the origin. It provides a reference for measurement. The x-axis is the horizontal line on a graph running left-right through the origin. It provides a reference for measurement. The x-axis The x-axis The horizontal line on a graph running left-right through the origin. horizontal; parallel to the horizon. horizontal; parallel to the horizon. horizontal; parallel to the horizon. horizontal; parallel to the horizon. horizontal horizontal Parallel to the horizon.
  The y-axis is the vertical line on a graph running up-down through the origin, used as a reference for measurement. The y-axis is the vertical line on a graph running up-down through the origin, used as a reference for measurement. The y-axis is the vertical line on a graph running up-down through the origin, used as a reference for measurement. The y-axis is the vertical line on a graph running up-down through the origin, used as a reference for measurement. The y-axis The y-axis The vertical line on a graph running up-down through the origin. vertical; up-down direction on a graph or map. vertical; up-down direction on a graph or map. vertical; up-down direction on a graph or map. vertical; up-down direction on a graph or map. vertical vertical Up-down direction on a graph or map.
  Image caption, Back to top
 Understanding the four quadrants of a graph
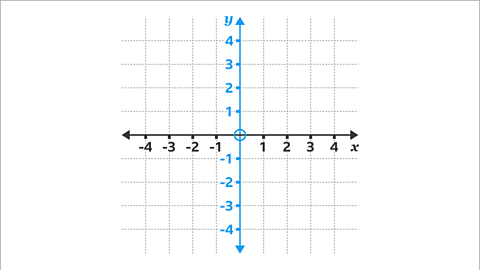
- When the x-axis and the y-axis intersect, they create four quadrants. The point where they cross is called the origin.
- The x-axis is horizontal, while the y-axis is vertical.
- The axes consist of two reference lines, one horizontal and one vertical, intersecting at right angles. They help define the position of a point on a grid. Axes is the plural of axis.
- The axes are labeled with numbers that are regularly spaced from the origin and aligned with the gridlines.
- The scale of the axes refers to the regular intervals at which values increase on each axis. It is not necessary for the scales of the x-axis and y-axis to be the same.
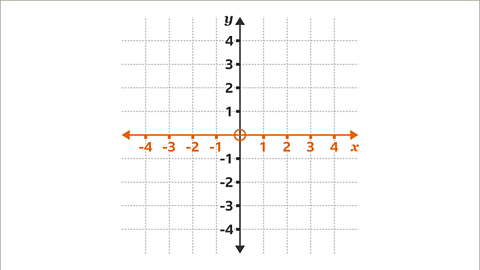
- The x-axis is labeled with positive numbers increasing to the right and negative numbers decreasing to the left from the origin.
- The y-axis is labeled with positive numbers increasing upwards and negative numbers decreasing downwards from the origin.
Examples to Understand:
- Example 1: Consider a point at coordinates (3, 4). Here, 3 represents the position along the x-axis, and 4 represents the position along the y-axis.
- Example 2: In a Cartesian coordinate system, the first quadrant is where both x and y coordinates are positive.

 Four QuadrantsOrigin
 Horizontal
 Vertical
Axes
- Reference lines include two axes, one horizontal and one vertical, intersecting at right angles. These lines help pinpoint a location on a grid.
- Axes, in the context of a grid, are crucial for determining the position of a point accurately.
Examples:
- Imagine a graph paper where the horizontal line represents the x-axis and the vertical line represents the y-axis. The point (3,4) lies three units along the x-axis and four units along the y-axis from the origin.
Scale of Axes
- The scale of axes refers to the consistent intervals that values increase by on each axis.
Examples:
- In a temperature graph, if each mark on the vertical (y) axis represents 10 degrees, the scale of the y-axis is 10 units per mark.
- The x-axis is labeled with positive numbers increasing to the right and negative numbers decreasing to the left of the origin.
- The y-axis is labeled with positive numbers increasing up and negative numbers decreasing down from the origin.


- Understanding axes and coordinates is essential when drawing and utilizing axes in all four quadrants. Inequality statements can be used to describe the range of values for each axis.
Examples
Image gallerySkip image gallery- When the horizontal axis and the vertical axis intersect, they create four quadrants.
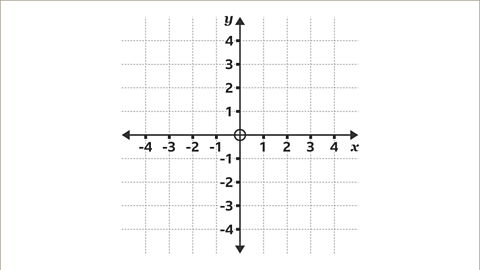 Image caption
When the horizontal axis and the vertical axis intersect, they create four quadrants.
- Image caption: The x-axis is labeled with positive numbers increasing to the right of the origin and negative numbers decreasing to the left of the origin.
- Image caption: The y-axis is labeled with positive numbers increasing up from the origin and negative numbers decreasing down from the origin.
- Image caption: Draw a pair of axes with x and y values from -6 to 6.
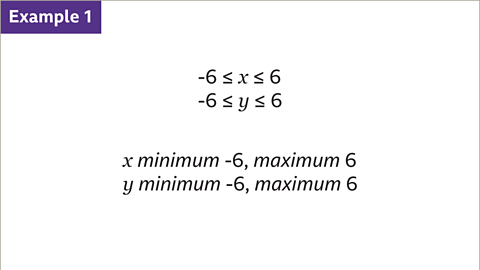
Understanding Graphs and Inequalities
Graphs are visual representations that help us understand mathematical concepts better. Inequalities on graphs show ranges of numbers that satisfy specific conditions.
Explanation of Axes on Graphs
Understanding Axis Numbering
Visualizing Graphs with Examples
| Graph Image | Description |
|---|---|
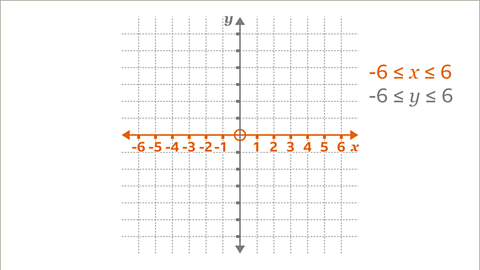 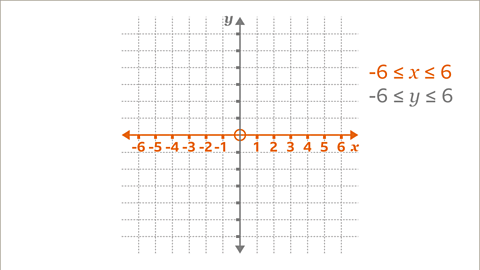 | Each axis labeled from -6 to 6, showing inequalities and axis numbering. |
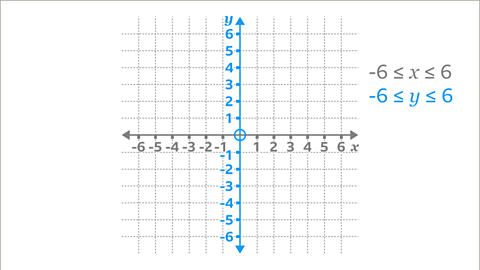 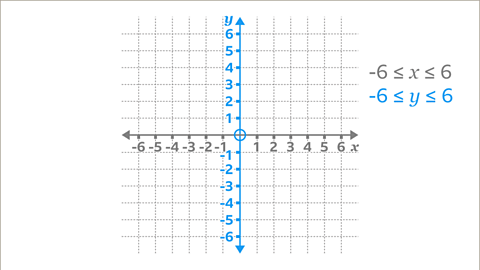 | Graphs illustrating axis ranges and inequalities for 𝑥 and 𝑦 values. |
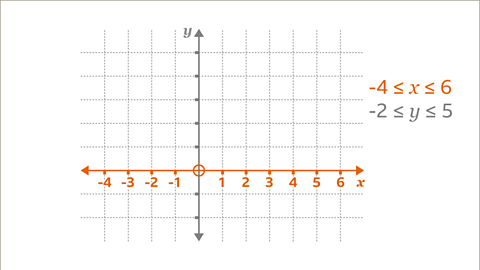 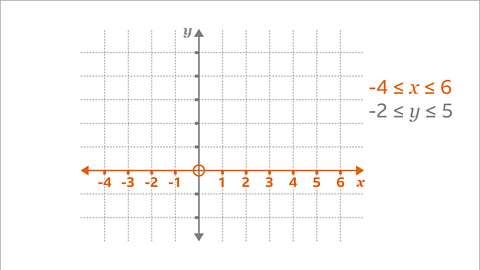 | Graphs depicting horizontal axis numbering and corresponding inequalities. |
Understanding the Inequality
- The inequality -2 ≤ 𝑦 ≤ 5 indicates that the vertical axis should be labeled from -2 to 5. Numbers are placed at regular intervals above and below the origin. Positive numbers ascend towards 5, while negative numbers descend towards -2.
Graph Representation
- Visual Description: The graph displays the x-axis and y-axis incrementing by one from -2 to 5, highlighted in blue. The range -2 ≤ y ≤ 5 is highlighted in blue on the right side of the graph.
Understanding Quadrants
- Intersection Point: When the x-axis and y-axis intersect, they form four quadrants in the coordinate plane.
Question
- Explain the concept of inequalities and their representation on a graph with detailed examples.
Plotting points in all four quadrants
The concept of plotting points in all four quadrants involves using coordinates to define the position of a point on a coordinate plane. The ordered pair of numbers that specifies this position is known as the coordinate pair or coordinates.
- The notation (x, y) gives a position on a coordinate plane.
- The first coordinate value, x, represents horizontal movement from the origin.
- The second coordinate value, y, represents vertical movement from the origin.
- The point's position on the axes is determined by the combined horizontal and vertical movements.
Examples:
 The notation (3, 4) indicates a point located at 3 units to the right and 4 units up from the origin.
  If the x-coordinate is -2, the point moves 2 units to the left from the origin.
  A y-coordinate of -5 means the point shifts 5 units downwards from the origin.
  By combining x and y movements, the point (3, -2) is plotted in the second quadrant.
 |
Download the notes
Plotting coordinates in the four quadrants
|
Download as PDF |
Understanding Coordinate System in Mathematics
- The Coordinate Plane: The coordinate plane consists of four quadrants that enable the plotting of points with both negative and positive values.
- Plotting Points:
- Plotting points like (8, 9), (6, -10), (-3, -6), and (-7, 5) involves moving along the x and y axes.
- Interpreting Coordinates:
- Understanding coordinates such as (8, 9) means the x-coordinate is 8 and the y-coordinate is 9. To plot this point, move 8 steps right and 9 steps up from the origin.
- Similarly, for coordinates like (6, -10), the x-coordinate is 6 and the y-coordinate is -10. The point is plotted by moving 6 steps right and 10 steps down from the origin.
- For coordinates like (-3, -6), the x-coordinate is -3 and the y-coordinate is -6. To plot this point, move 3 steps left and 6 steps down from the origin.
Visual Representation of Coordinates
- Visualizing points on the coordinate plane is crucial for understanding how coordinates work in mathematics.
Understanding Coordinate Geometry
- Definition of Coordinates: In coordinate geometry, a point in a plane is located using two numbers that represent its distances from two perpendicular lines called axes.
- Representation of Coordinates: Coordinates are typically written as (x, y), where x represents the distance along the x-axis and y represents the distance along the y-axis.
- Plotting Coordinates: To plot a point such as (-7, 5), you move 7 steps to the left along the x-axis (horizontal) to -7 and then 5 steps up on the y-axis (vertical) to 5 from the origin.
Graphical Representation
- Quadrants: The plane is divided into four quadrants, allowing both positive and negative values to be plotted. Each quadrant has specific characteristics based on the signs of x and y coordinates.
| Quadrant | Sign of x | Sign of y |
|---|---|---|
| I | + | + |
| II | - | + |
| III | - | - |
| IV | + | - |
Visualizing Coordinates
- Graphical Depiction: A graph displays the x and y axes intersecting at the origin (0, 0) with points labeled according to their coordinates in each quadrant.
Practise using the four quadrants
Quiz
- Practice reading and plotting across the four quadrants. It's beneficial to have a pen and paper handy for assistance with your responses.
Real-life maths
 Image caption
Archaeologists utilize coordinate grids in their work to unearth and locate historical artifacts by carefully excavating them from the earth.
A grid with string guidelines is established over the excavation site to accurately map the position of discovered items.
 Image caption
Establishing a grid system is crucial for maintaining accuracy during an archaeological excavation.
 Image caption
The x and y axes operate in a two-dimensional plane, while three-dimensional coordinates are employed in Computer-Aided Design (CAD) software.
Two-dimensional and Three-dimensional
- These dimensions refer to the spatial properties of objects.
- Two-dimensional objects exist on a flat plane, like drawings or images.
- Three-dimensional objects have depth, width, and height, resembling real-world objects.
Computer-Aided Design (CAD)
- CAD tools enable users to create three-dimensional images.
- They are essential for various industries such as game development, software engineering, and animation.
- Game programmers utilize CAD for creating immersive gaming experiences.
- Software engineers rely on CAD for product design and development.
- Film animation professionals use CAD for crafting lifelike animations.
Game - Divided Islands
- This game involves strategically managing resources on separate islands.
- Players must balance their resources to thrive and overcome challenges.
- It tests players' decision-making skills and resource management abilities.
- The game's complexity increases as players progress, offering a challenging gaming experience.
 |  |


