Year 7 Exam > Year 7 Notes > Line Graphs
Line Graphs - Year 7 PDF Download

Introduction
- A line graph is a visual representation that helps in identifying patterns in data over time, such as tracking changes in hours over a day or months within a year. It connects data points using line segments for clearer visualization.
- When depicting information in a line chart, the vertical scale typically indicates the frequency of occurrences, while the horizontal scale signifies the time intervals. This setup aids in understanding how data changes over time.
- Certain line graphs incorporate a false origin, a feature that allows for adjusting the starting point of the vertical scale to better illustrate data trends accurately.
How to create a line graph
- To begin creating a line graph, you need data typically presented in a table format.
- To create a line graph, follow these steps:
- Identify the highest frequency in your data table.
- Draw a vertical axis on your graph paper.
- Select an appropriate scale for this axis and label it up to the highest frequency.
- Determine the number of subdivisions needed for the horizontal axis.
- Draw and label the horizontal axis.
- Plot each data point according to the frequencies and time intervals.
- Connect each data point to the next with straight lines.
- Ensure both axes are correctly labeled, and add a title to your line graph.
Example
Example: The line graph below shows the number of parcel deliveries completed on each day of the week.
How many parcels were delivered on Wednesday?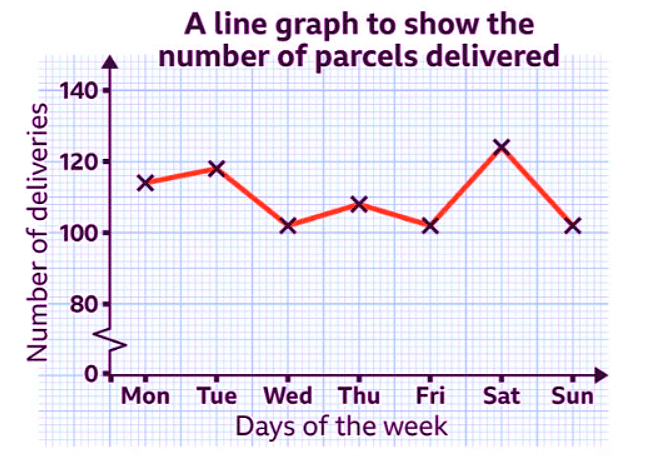 Sol: The number of parcels delivered on Wednesday is 102
A false origin has been used on the vertical scale.
The scale is going up in increments of 20
Between each multiple of 20 is ten subdivisions.
Each subdivision is worth two parcels.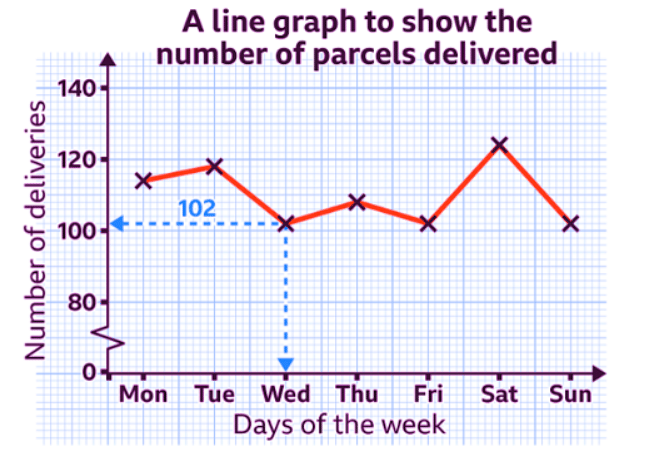
Real-life maths
- An investor is a person who puts money (capital) into something with the expectation of a future financial return. They might use line graphs to track the value of companies over time.
- By watching the rise and fall in a company's share value, they might be able to work out a good time to buy and sell shares in order to get the best return.
About this Document

Oct 19, 2025
Last updated
Related Exams
Document Description: Line Graphs for Year 7 2025 is part of Year 7 preparation. The notes and questions for Line Graphs have been prepared according to the Year 7 exam syllabus. Information about Line Graphs covers topics like Introduction, How to create a line graph, Real-life maths and Line Graphs Example, for Year 7 2025 Exam. Find important definitions, questions, notes, meanings, examples, exercises and tests below for Line Graphs.
Description
Full syllabus notes, lecture & questions for Line Graphs - Year 7 - Year 7 | Plus excerises question with solution to help you revise complete syllabus | Best notes, free PDF download
Information about Line Graphs
In this doc you can find the meaning of Line Graphs defined & explained in the simplest way possible.
Besides explaining types of Line Graphs theory,
EduRev gives you an ample number of questions to practice Line Graphs tests, examples and also practice Year 7 tests.
Related Searches
shortcuts and tricks
,Line Graphs - Year 7
,Objective type Questions
,Previous Year Questions with Solutions
,Viva Questions
,Sample Paper
,practice quizzes
,Exam
,Semester Notes
,Line Graphs - Year 7
,Important questions
,mock tests for examination
,MCQs
,Free
,Extra Questions
,ppt
,video lectures
,study material
,past year papers
,Line Graphs - Year 7
,Summary
;


Additional Information about Line Graphs for Year 7 Preparation
Line Graphs Free PDF Download
The Line Graphs is an invaluable resource that delves deep into the core of the Year 7 exam.
These study notes are curated by experts and cover all the essential topics and concepts, making your preparation more efficient and effective.
With the help of these notes, you can grasp complex subjects quickly, revise important points easily,
and reinforce your understanding of key concepts. The study notes are presented in a concise and easy-to-understand manner,
allowing you to optimize your learning process. Whether you're looking for best-recommended books, sample papers, study material,
or toppers' notes, this PDF has got you covered. Download the Line Graphs now and kickstart your journey towards success in the Year 7 exam.
Importance of Line Graphs
The importance of Line Graphs cannot be overstated, especially for Year 7 aspirants.
This document holds the key to success in the Year 7 exam.
It offers a detailed understanding of the concept, providing invaluable insights into the topic.
By knowing the concepts well in advance, students can plan their preparation effectively.
Utilize this indispensable guide for a well-rounded preparation and achieve your desired results.
Line Graphs Notes
Line Graphs Notes offer in-depth insights into the specific topic to help you master it with ease.
This comprehensive document covers all aspects related to Line Graphs.
It includes detailed information about the exam syllabus, recommended books, and study materials for a well-rounded preparation.
Practice papers and question papers enable you to assess your progress effectively.
Additionally, the paper analysis provides valuable tips for tackling the exam strategically.
Access to Toppers' notes gives you an edge in understanding complex concepts.
Whether you're a beginner or aiming for advanced proficiency, Line Graphs Notes on EduRev are your ultimate resource for success.
Line Graphs Year 7 Questions
The "Line Graphs Year 7 Questions" guide is a valuable resource for all aspiring students preparing for the
Year 7 exam. It focuses on providing a wide range of practice questions to help students gauge
their understanding of the exam topics. These questions cover the entire syllabus, ensuring comprehensive preparation.
The guide includes previous years' question papers for students to familiarize themselves with the exam's format and difficulty level.
Additionally, it offers subject-specific question banks, allowing students to focus on weak areas and improve their performance.
Study Line Graphs on the App
Students of Year 7 can study Line Graphs alongwith tests & analysis from the EduRev app,
which will help them while preparing for their exam. Apart from the Line Graphs,
students can also utilize the EduRev App for other study materials such as previous year question papers, syllabus, important questions, etc.
The EduRev App will make your learning easier as you can access it from anywhere you want.
The content of Line Graphs is prepared as per the latest Year 7 syllabus.
|
© EduRev
|
Education Revolution
|


|


Signup to see your scores
go up within 7 days!
Access 1000+ FREE Docs, Videos and Tests
Takes less than 10 seconds to signup