Class 10 Exam > Class 10 Notes > Mathematics for GCSE/IGCSE > Quadratic Graphs
Quadratic Graphs | Mathematics for GCSE/IGCSE - Class 10 PDF Download
Definition of Quadratic Function
- A quadratic function has the form y = ax2 + bx + c where a ≠ 0.
- Quadratic functions are common in mathematics, making it important to understand their key features.
What does a quadratic graph look like?
- The shape formed by a quadratic graph is called a parabola.
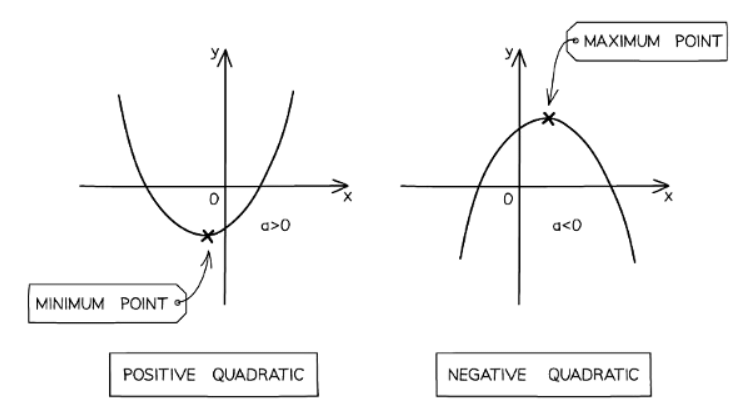
- A parabola can appear as either a "u-shape" or an "n-shape".
- If the coefficient of x2 is positive, the parabola is a "u-shape".
- If the coefficient of x2 is negative, the parabola is an "n-shape".
- A quadratic graph always intersects the y-axis.
- A quadratic graph may intersect the x-axis twice, once, or not at all.
- The points where the graph intersects the x-axis are known as the roots.
- A "u-shape" parabola has a minimum point (the bottom of the "u").
- An "n-shape" parabola has a maximum point (the top of the "n").
- Minimum and maximum points are types of turning points.

How to Sketch a Quadratic Graph?
- We can create a table of values for the function and plot it accurately, but often a sketch highlighting key features is sufficient.
- The most important features of a quadratic are:
- Its overall shape: a "u-shape" or an "n-shape".
- Its y-intercept.
- Its x-intercept(s), also known as the roots.
- Its minimum or maximum point (turning point).
- If the coefficient a in ax2 + bx + c is positive, the quadratic will be a "u-shape".
- If the coefficient a in ax2 + bx + c is negative, the quadratic will be an "n-shape".
- The y-intercept of y = ax2 + bx + c is (0, c).
- The roots, or x-intercepts, are the solutions to y = 0, i.e., ax2 + bx + c = 0.
- You can solve a quadratic by factorizing, completing the square, or using the quadratic formula.
- There may be 2, 1, or 0 solutions, and therefore 2, 1, or 0 roots.
- The minimum or maximum point of a quadratic can be found by:
- Completing the square: Once the quadratic is written in the form y = a(x − q)2 + r, the minimum or maximum point is given by (q, r).
- Be careful with the sign of the x-coordinate. For example, if the equation is y = (x − 3)2 + 2, the minimum point is (3, 2), but if the equation is y = (x + 3)2 + 2, the minimum point is (−3, 2).
- Using differentiation: Solving dx/dy = 0 will find the x-coordinate of the minimum or maximum point. You can then substitute this value into the quadratic equation to find the y-coordinate.
- Completing the square: Once the quadratic is written in the form y = a(x − q)2 + r, the minimum or maximum point is given by (q, r).
The document Quadratic Graphs | Mathematics for GCSE/IGCSE - Class 10 is a part of the Class 10 Course Mathematics for GCSE/IGCSE.
All you need of Class 10 at this link: Class 10
|
66 videos|674 docs|19 tests
|
FAQs on Quadratic Graphs - Mathematics for GCSE/IGCSE - Class 10
| 1. How can completing the square help in sketching a quadratic graph? |  |
Ans. Completing the square is a method used to rewrite a quadratic function in vertex form, which makes it easier to identify key points such as the vertex, axis of symmetry, and direction of opening. This information is crucial for accurately sketching a quadratic graph.
| 2. What are some key points to consider when sketching a quadratic graph? |  |
Ans. When sketching a quadratic graph, it is important to identify the vertex, axis of symmetry, direction of opening, and any x-intercepts or y-intercepts. These key points help in accurately representing the shape of the graph.
| 3. How can understanding quadratic functions help in graph sketching? |  |
Ans. Understanding quadratic functions allows us to analyze the behavior of the graph, such as whether it opens upwards or downwards, the location of the vertex, and how the graph intersects the x-axis and y-axis. This knowledge is essential for accurately sketching a quadratic graph.
| 4. What are some common mistakes to avoid when sketching a quadratic graph? |  |
Ans. Common mistakes when sketching a quadratic graph include not correctly identifying the vertex, axis of symmetry, or direction of opening, not accurately plotting key points, and incorrectly connecting the points to form the graph. It is important to pay attention to these details to avoid errors in the sketch.
| 5. How can graph sketching with key points help in understanding a quadratic graph? |  |
Ans. Graph sketching with key points involves plotting specific points on the graph, such as the vertex, x-intercepts, and y-intercepts, to create an accurate representation of the quadratic function. This method helps in visualizing the behavior of the graph and understanding its overall shape and characteristics.
Related Searches


