Class 10 Exam > Class 10 Notes > Mathematics for GCSE/IGCSE > Rates of Change of Graphs
Rates of Change of Graphs | Mathematics for GCSE/IGCSE - Class 10 PDF Download
Introduction
Real-life graphs aren't limited to depicting distance, speed, and time; they can illustrate the connection between any two variables, though they often portray how something changes over time.
What is a rate of change?
- A rate of change refers to how a variable evolves over time or in relation to another variable.
- Examples of rates of change include:
- Speed: the change in distance divided by time.
- Acceleration: the change in speed divided by time.
- The water level in a container as it fills up: the change in depth divided by time.
- The volume of air inside an inflating balloon as its radius increases: the change in volume divided by the change in radius.
- The number of ice creams sold as the temperature rises: the change in ice creams sold divided by the change in temperature.
Question for Rates of Change of GraphsTry yourself: What does a rate of change refer to?View Solution
How can I use a graph to find rates of change?
- We can apply similar techniques used for distance-time and speed-time graphs to determine the rate of change.
- To calculate the rate of change of a unit on the y-axis per unit change in the x-axis, which is often time, we can analyze the gradient of the graph.
- The units of the rate of change correspond to the units of the y-axis divided by the units of the x-axis.
- For instance, if the graph represents volume in cm3 on the y-axis and time in seconds on the x-axis, the rate of change would be expressed as cm3/s or cm3 s-1.
- On a straight line graph, the rate of change remains constant.
- When the graph is horizontal, the rate of change is zero, indicating that y does not vary as x changes.
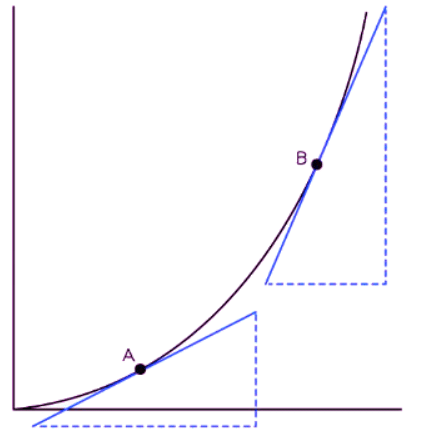
- For a curved graph, it is possible to draw a tangent at a specific point to determine its gradient, providing an estimate of the rate of change at that point.
- This tangent allows us to gauge the rate of change more accurately.
- The rate of change is greater when the graph is steeper, denoting a higher gradient.
- In the below image, tangents drawn at points A and B show that the graph is steeper at B
- Therefore the rate of change at B is greater

The document Rates of Change of Graphs | Mathematics for GCSE/IGCSE - Class 10 is a part of the Class 10 Course Mathematics for GCSE/IGCSE.
All you need of Class 10 at this link: Class 10
|
66 videos|674 docs|19 tests
|
FAQs on Rates of Change of Graphs - Mathematics for GCSE/IGCSE - Class 10
| 1. What is the concept of rates of change in graphs? |  |
Ans. Rates of change in graphs refer to how quickly the values of one variable change in relation to another variable on a graph. It shows the steepness or slope of a line on a graph.
| 2. How can you determine the rate of change from a graph? |  |
Ans. To determine the rate of change from a graph, you can calculate the slope of the line by finding the difference in the values of the variables and dividing by the corresponding difference in the other variable.
| 3. How does understanding rates of change help in analyzing graphs? |  |
Ans. Understanding rates of change helps in analyzing graphs as it provides insight into how one variable is changing in response to changes in another variable. It helps in making predictions and interpreting trends in data.
| 4. Why is it important to visualize rates of change on a graph? |  |
Ans. Visualizing rates of change on a graph helps in easily interpreting the data and understanding the relationship between variables. It provides a clear representation of how one variable is changing with respect to another.
| 5. Can rates of change be negative on a graph? |  |
Ans. Yes, rates of change can be negative on a graph. A negative rate of change indicates a decrease in one variable as the other variable increases. It shows a downward slope on the graph.
Related Searches


