Class 10 Exam > Class 10 Notes > Mathematics for GCSE/IGCSE > Trigonometric Graphs
Trigonometric Graphs | Mathematics for GCSE/IGCSE - Class 10 PDF Download
Drawing Trig Graphs
Why do we need to know what trig graphs look like?
- Trigonometric graphs, commonly referred to as trig graphs, find applications across various mathematical domains.
- For instance, their oscillatory behavior proves instrumental in modeling phenomena such as pendulum swings or tide heights.
How do we draw trig graphs?
- Being acquainted with the general style of trigonometric graphs facilitates quick sketching and aids in finding values or angles without reliance solely on calculators.
- All trigonometric graphs conform to a specific pattern - they initiate from a "starting point" and then exhibit a regular occurrence every 90 degrees.
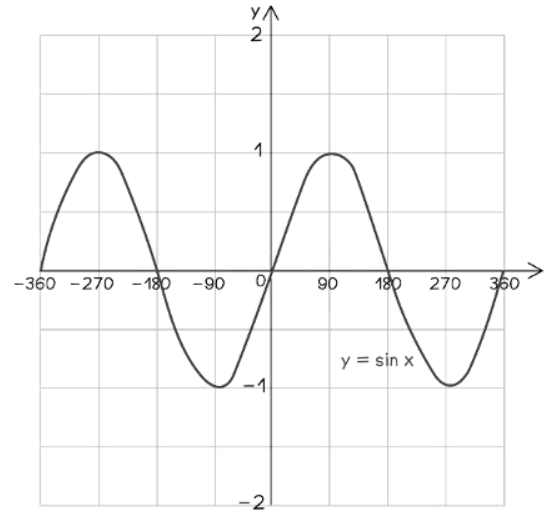
Sine Graph:
- y = sin x
- Starts at (0,0)
- Every 90° it cycles through 1, 0, -1, 0, ...

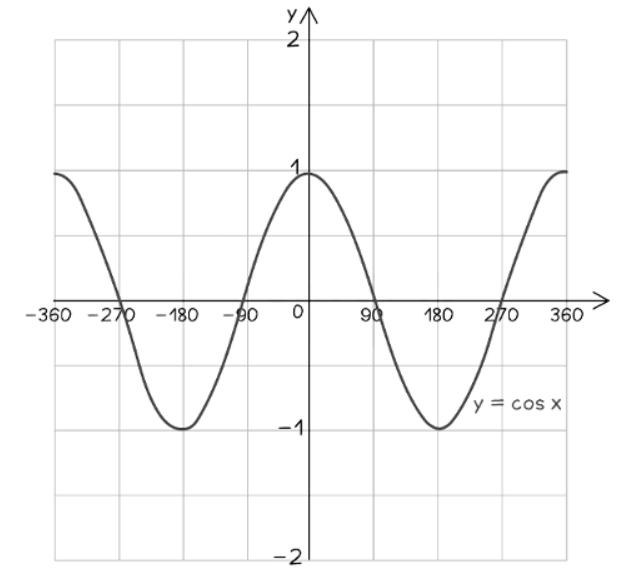
Cosine Graph:
- y = cos x
- Starts at (0, 1)
- Every 90° it cycles through 0, -1, 0, 1, ...

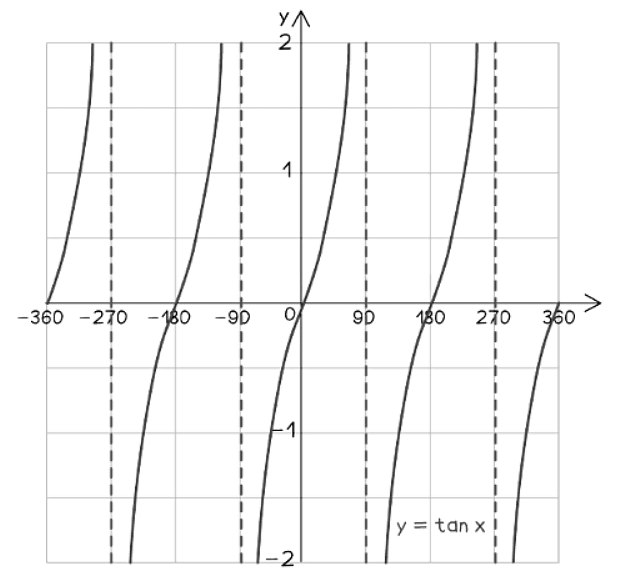
Tangent Graph:
- y = tan x
- Starts at (0, 0)
- Every 90° it is either 0 or an asymptote
- An asymptote is a line that a graph gets ever closer to, without ever crossing or touching it

The document Trigonometric Graphs | Mathematics for GCSE/IGCSE - Class 10 is a part of the Class 10 Course Mathematics for GCSE/IGCSE.
All you need of Class 10 at this link: Class 10
|
66 videos|674 docs|19 tests
|
FAQs on Trigonometric Graphs - Mathematics for GCSE/IGCSE - Class 10
| 1. Can you explain how to draw trigonometric graphs step by step? |  |
Ans. To draw trigonometric graphs, start by plotting the key points for one period of the function, such as the maximum and minimum points, the x-intercepts, and the points at which the function starts repeating itself. Then, connect these points smoothly to form the graph. Make sure to label the axes and key points on the graph for clarity.
| 2. What are the important characteristics of a trigonometric graph? |  |
Ans. Some important characteristics of a trigonometric graph include amplitude, period, phase shift, and vertical shift. The amplitude determines the height of the graph, the period is the length of one complete cycle, the phase shift is any horizontal translation of the graph, and the vertical shift moves the entire graph up or down.
| 3. How do you identify the period of a trigonometric function from its equation? |  |
Ans. To identify the period of a trigonometric function from its equation, look for the coefficient of x inside the function. The period is calculated as 2π divided by this coefficient. For example, if the function is y = sin(2x), the period would be 2π/2 = π.
| 4. What is the significance of the amplitude in a trigonometric graph? |  |
Ans. The amplitude in a trigonometric graph determines the maximum distance the graph extends from the midline. It is half the distance between the maximum and minimum values of the function and affects the height of the graph. A larger amplitude results in a taller graph, while a smaller amplitude results in a shorter graph.
| 5. How can you use trigonometric graphs to solve real-life problems? |  |
Ans. Trigonometric graphs can be used to model and solve various real-life problems involving periodic phenomena, such as sound waves, ocean tides, and electrical currents. By analyzing the amplitude, period, and phase shift of the graph, one can make predictions and solve practical problems related to these phenomena.
Related Searches


