Class 10 Exam > Class 10 Notes > Mathematics for GCSE/IGCSE > Probability & Venn Diagrams
Probability & Venn Diagrams | Mathematics for GCSE/IGCSE - Class 10 PDF Download
Probability & Venn Diagrams
What is a Venn diagram?
- Venn diagrams illustrate two (or more) characteristics of a situation, highlighting areas of overlap.
- For instance, in a sixth form, students can study biology or chemistry, and there might be students studying both subjects.
What might I be asked to do with a Venn diagram?
- You may be asked to draw or interpret a Venn diagram.
- The rectangle (box) in a Venn diagram is essential; it represents all possible outcomes.
- The letters calligraphic E, ξ, U, or S inside or near the box indicate "the set of all possible outcomes."
- AND and OR are crucial terms in drawing and interpreting Venn diagrams.
- Familiarize yourself with the symbols ∩ (intersection) and ∪ (union).
- ∩ means AND (intersection).
- ∪ means OR (union).
How do I draw a Venn diagram?
- Commence with a "box" and overlapping "bubbles". Typically, 2-3 bubbles are used based on the characteristics involved.
- Determine the number of bubbles required based on the characteristics.
- Usually, 2-3 bubbles are adequate for most scenarios.
- Systematically analyze each piece of information to progressively fill in sections of the Venn diagram. Sometimes, information needs to be combined before inclusion in the diagram.
- Not all values may be explicitly provided; some might need to be deduced. This problem-solving is crucial for completing the Venn diagram accurately.
- Always consider the implications of AND and OR operations when interpreting data for the diagram.
How do I interpret a Venn diagram?
- Identify the parts of the Venn diagram needed to answer a question.
- Shading relevant parts of a Venn diagram can aid in understanding.
- Pay attention to probability notations like A' (not A) and symbols ∩ and ∪.
How do I use Venn diagrams with conditional probability?
- Conditional probabilities involve finding the likelihood of an event given that another event has occurred.
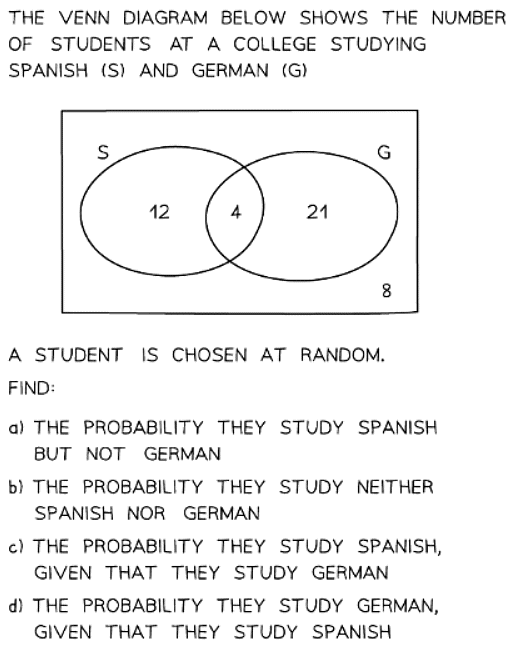
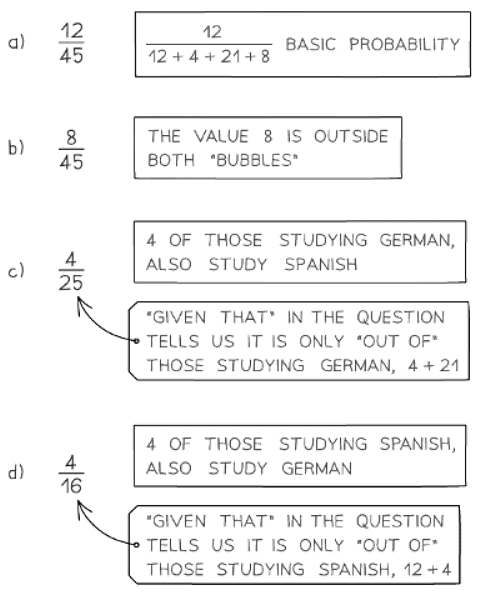
- For instance, to find the probability that a student studies German, given that the student also studies Spanish, we use specific calculations.
Calculation of Conditional Probabilities
- To determine the probability of an intersection, such as 'Spanish AND German,' divide this value by the sum of all probabilities in the 'Spanish' section of the diagram.
- Conditional probabilities are sometimes represented using the 'straight bar' notation, denoted as 'the probability of A given B.'
- For example, this could refer to the chance that a student studies German, provided that the student also studies Spanish.
Interpreting Conditional Probability Notations
- The notation 'the probability of A given B' signifies the probability of event A occurring given that event B has occurred.
- For example, this notation could indicate the probability that a student studies German, considering that the student also studies Spanish.


Question for Probability & Venn DiagramsTry yourself: In a school, students can choose to participate in either basketball or soccer. Some students play both sports. Which of the following best represents the Venn diagram for this situation?View Solution
The document Probability & Venn Diagrams | Mathematics for GCSE/IGCSE - Class 10 is a part of the Class 10 Course Mathematics for GCSE/IGCSE.
All you need of Class 10 at this link: Class 10
|
109 videos|689 docs|60 tests
|
FAQs on Probability & Venn Diagrams - Mathematics for GCSE/IGCSE - Class 10
| 1. What is the purpose of using Venn diagrams in probability? |  |
Ans. Venn diagrams are used in probability to visually represent the relationships between different sets of events or outcomes, making it easier to calculate probabilities and understand the likelihood of certain events occurring.
| 2. How do you calculate the probability of events using a Venn diagram? |  |
Ans. To calculate the probability of events using a Venn diagram, you can use the number of elements in each set and their intersections. By dividing the number of favorable outcomes by the total number of possible outcomes, you can determine the probability of an event.
| 3. Can Venn diagrams be used for more than two sets of events in probability? |  |
Ans. Yes, Venn diagrams can be used for more than two sets of events in probability. By adding more circles to represent additional sets and their intersections, you can analyze the relationships between multiple events and calculate their probabilities.
| 4. How are Venn diagrams helpful in understanding complex probability scenarios? |  |
Ans. Venn diagrams provide a visual representation of the relationships between different events, making it easier to analyze complex probability scenarios. By visually organizing the information, you can identify commonalities and calculate probabilities more effectively.
| 5. What are some common mistakes to avoid when using Venn diagrams in probability calculations? |  |
Ans. Some common mistakes to avoid when using Venn diagrams in probability calculations include not accurately representing the events or their intersections, miscounting elements in each set, and overlooking possible outcomes. It is important to carefully construct the Venn diagram and double-check calculations to ensure accurate results.
Related Searches


