Class 10 Exam > Class 10 Notes > Mathematics for GCSE/IGCSE > Range & Quartiles
Range & Quartiles | Mathematics for GCSE/IGCSE - Class 10 PDF Download

Range & IQR
What are the range and interquartile range (IQR)?
- The three measures of central tendency—mean, median, and mode—indicate what is typical within the data, showing what is approximately in the center.
- The range and interquartile range (IQR) quantify the dispersion of the data.
- These metrics are applicable exclusively to numerical data.
- Fortunately, both are straightforward to calculate.
How do I work out the range?
- The range is calculated as the difference between the highest and lowest data values.
- It indicates the extent of data dispersion.
- You can recall this as "Hi - Lo."
- There is a potential issue with using the range:
- Since it takes into account only the highest and lowest values, it can be affected by outliers.
- These outliers may not accurately reflect the overall spread of the data.
How do I find the quartiles?
- The median divides the data set into two equal parts, positioned halfway along the data.
- Quartiles, as their name implies, split the data set into four equal parts:
- The lower quartile (LQ) is located one quarter of the way through the data (when ordered).
- The upper quartile (UQ) is located three quarters of the way through the data.
- The median can also be referred to as the second quartile.
- To find quartiles, first use the median to split the data set into lower and upper halves:
- Ensure the data is sorted numerically.
- If the data set has an even number of values:
- The first half consists of the lower values, and the second half consists of the higher values.
- In this case, all data points are included in one of the two halves.
- If the data set has an odd number of values:
- The lower half includes all values below the median.
- The upper half includes all values above the median.
- The median itself is excluded from both halves.
- The lower quartile is the median of the lower half of the data set, and the upper quartile is the median of the upper half.
- Find the quartiles in the same way you would find the median for any data set, focusing only on the lower or upper half accordingly.
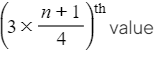
- Sometimes you may also see the quartiles given in formula form
- For n data values:
- the lower quartile is the
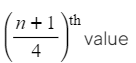
- the upper quartile is the
- the lower quartile is the
- Using these can save finding the median and splitting the data into two halves
- For n data values:
How do I work out the interquartile range (IQR)?
- The interquartile range (IQR) is the difference between the upper quartile (UQ) and the lower quartile (LQ).
- To calculate the IQR, you must first determine the quartiles.
- The formula for the interquartile range is IQR = UQ - LQ.
- The IQR measures the spread of the middle 50% of the data, making it resistant to the influence of extreme values.
- Conversely, the range of a data set can be impacted by extremely high or low values.
Question for Range & QuartilesTry yourself: What is the range?View Solution
The document Range & Quartiles | Mathematics for GCSE/IGCSE - Class 10 is a part of the Class 10 Course Mathematics for GCSE/IGCSE.
All you need of Class 10 at this link: Class 10
|
66 videos|674 docs|19 tests
|
FAQs on Range & Quartiles - Mathematics for GCSE/IGCSE - Class 10
| 1. What is the purpose of calculating the range and quartiles in statistical analysis? |  |
Ans. The range and quartiles help in understanding the spread and distribution of data, allowing for better analysis and comparison of different data sets.
| 2. How can quartiles help in identifying outliers in a data set? | |
Ans. Quartiles divide a data set into four equal parts, making it easier to identify extreme values that may be outliers when compared to the rest of the data.
| 3. How does the interquartile range (IQR) differ from the range in statistical analysis? | |
Ans. The range is the difference between the maximum and minimum values in a data set, while the IQR is the range of the middle 50% of the data, providing a more focused measure of data variability.
| 4. Why is it important to calculate quartiles in data analysis? | |
Ans. Quartiles provide insights into the distribution and variability of data, helping in making informed decisions and drawing meaningful conclusions from statistical analysis.
| 5. How can understanding statistical ranges and quartiles help in making predictions based on data trends? | |
Ans. By analyzing quartiles and ranges, one can identify patterns, trends, and outliers in data, which can be used to make accurate predictions and forecasts based on statistical analysis.
About this Document

Oct 23, 2025
Last updated
Related Exams
Document Description: Range & Quartiles for Class 10 2025 is part of Mathematics for GCSE/IGCSE preparation.
The notes and questions for Range & Quartiles have been prepared according to the Class 10 exam syllabus. Information about Range & Quartiles covers topics
like Range & IQR and Range & Quartiles Example, for Class 10 2025 Exam. Find important definitions, questions, notes, meanings, examples, exercises and tests below for Range & Quartiles.
Introduction of Range & Quartiles in English is available as part of our Mathematics for GCSE/IGCSE
for Class 10 & Range & Quartiles in Hindi for Mathematics for GCSE/IGCSE course.
Download more important topics related with notes, lectures and mock test series for Class 10
Exam by signing up for free. Class 10: Range & Quartiles | Mathematics for GCSE/IGCSE - Class 10
Description
Full syllabus notes, lecture & questions for Range & Quartiles | Mathematics for GCSE/IGCSE - Class 10 - Class 10 | Plus excerises question with solution to help you revise complete syllabus for Mathematics for GCSE/IGCSE | Best notes, free PDF download
Information about Range & Quartiles
In this doc you can find the meaning of Range & Quartiles defined & explained in the simplest way possible. Besides explaining types of
Range & Quartiles theory, EduRev gives you an ample number of questions to practice Range & Quartiles tests, examples and also practice Class 10
tests

Related Searches
MCQs
,Extra Questions
,Range & Quartiles | Mathematics for GCSE/IGCSE - Class 10
,Important questions
,Sample Paper
,Range & Quartiles | Mathematics for GCSE/IGCSE - Class 10
,study material
,Viva Questions
,Previous Year Questions with Solutions
,Semester Notes
,Summary
,video lectures
,Range & Quartiles | Mathematics for GCSE/IGCSE - Class 10
,Free
,mock tests for examination
,shortcuts and tricks
,Objective type Questions
,practice quizzes
,Exam
,ppt
,past year papers
;


Additional Information about Range & Quartiles for Class 10 Preparation
Range & Quartiles Free PDF Download
The Range & Quartiles is an invaluable resource that delves deep into the core of the Class 10 exam.
These study notes are curated by experts and cover all the essential topics and concepts, making your preparation more efficient and effective.
With the help of these notes, you can grasp complex subjects quickly, revise important points easily,
and reinforce your understanding of key concepts. The study notes are presented in a concise and easy-to-understand manner,
allowing you to optimize your learning process. Whether you're looking for best-recommended books, sample papers, study material,
or toppers' notes, this PDF has got you covered. Download the Range & Quartiles now and kickstart your journey towards success in the Class 10 exam.
Importance of Range & Quartiles
The importance of Range & Quartiles cannot be overstated, especially for Class 10 aspirants.
This document holds the key to success in the Class 10 exam.
It offers a detailed understanding of the concept, providing invaluable insights into the topic.
By knowing the concepts well in advance, students can plan their preparation effectively.
Utilize this indispensable guide for a well-rounded preparation and achieve your desired results.
Range & Quartiles Notes
Range & Quartiles Notes offer in-depth insights into the specific topic to help you master it with ease.
This comprehensive document covers all aspects related to Range & Quartiles.
It includes detailed information about the exam syllabus, recommended books, and study materials for a well-rounded preparation.
Practice papers and question papers enable you to assess your progress effectively.
Additionally, the paper analysis provides valuable tips for tackling the exam strategically.
Access to Toppers' notes gives you an edge in understanding complex concepts.
Whether you're a beginner or aiming for advanced proficiency, Range & Quartiles Notes on EduRev are your ultimate resource for success.
Range & Quartiles Class 10 Questions
The "Range & Quartiles Class 10 Questions" guide is a valuable resource for all aspiring students preparing for the
Class 10 exam. It focuses on providing a wide range of practice questions to help students gauge
their understanding of the exam topics. These questions cover the entire syllabus, ensuring comprehensive preparation.
The guide includes previous years' question papers for students to familiarize themselves with the exam's format and difficulty level.
Additionally, it offers subject-specific question banks, allowing students to focus on weak areas and improve their performance.
Study Range & Quartiles on the App
Students of Class 10 can study Range & Quartiles alongwith tests & analysis from the EduRev app,
which will help them while preparing for their exam. Apart from the Range & Quartiles,
students can also utilize the EduRev App for other study materials such as previous year question papers, syllabus, important questions, etc.
The EduRev App will make your learning easier as you can access it from anywhere you want.
The content of Range & Quartiles is prepared as per the latest Class 10 syllabus.
|
© EduRev
|
Education Revolution
|


|


Signup to see your scores
go up within 7 days!
Access 1000+ FREE Docs, Videos and Tests
Takes less than 10 seconds to signup