Class 10 Exam > Class 10 Notes > Mathematics for GCSE/IGCSE > Bar Charts & Pictograms
Bar Charts & Pictograms | Mathematics for GCSE/IGCSE - Class 10 PDF Download
Bar Charts & Pictograms
What is a bar chart and what is it used for?
- A bar chart visually represents qualitative and/or discrete data such as colors of cars, shoe sizes, and names of students.
- Bar charts are ideal for situations with a small number of possible outcomes where the data is categorical (non-numerical).
- The vertical axis displays the frequency, starting at zero and increasing equally.
- The horizontal axis shows the different outcomes.
- Each bar in a bar chart represents an outcome, with the height indicating the frequency.
- All bars should have the same width, and there should be gaps between them.

- You can easily identify the mode using a bar chart.
- The mode represents the most common outcome in a dataset.
- It is depicted by the bar with the highest height.
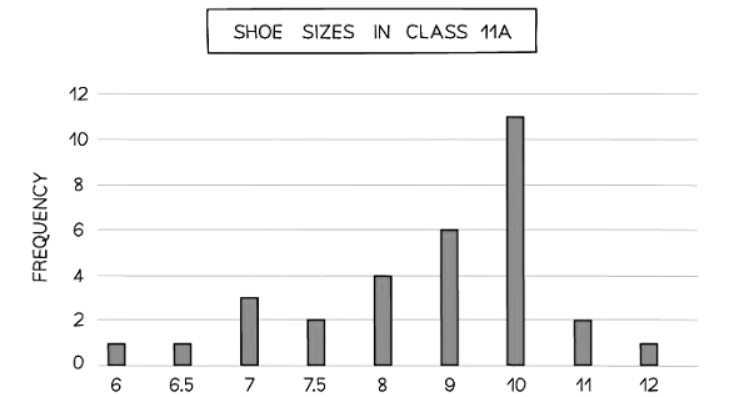
- For instance, in a bar chart showing shoe sizes, if size 10 has a frequency of 11, then 10 is the modal shoe size.
- Comparative bar charts are useful for comparing two or more datasets.
- In these charts, bars for each outcome are displayed for every dataset side by side without any gaps.
- To differentiate between bars from different datasets, colors or shading are used along with a key for clarity.
What is a pictogram and what is it used for?
- A pictogram offers an alternative to a bar chart, providing a visual representation of qualitative and/or discrete data.
- Like bar charts, pictograms are typically employed for categorical (non-numerical) data.
- Pictograms lack axes; instead, they use symbols to denote frequency.
- It's crucial to include a key in a pictogram indicating the frequency represented by one symbol.
- Half and quarter symbols are commonly utilized.
- Pictograms should follow similar conventions as bar charts to ensure ease of reading and interpretation.
- All symbols should maintain uniform size and shape.
- Symbols should be arranged in a manner that facilitates the clear observation of the highest frequency (the mode) and other relevant features.
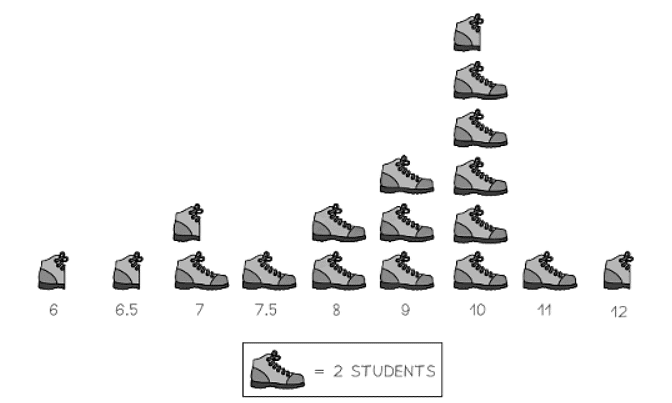
- Here's what a pictogram depicting the shoe sizes of class 11A would resemble.

Question for Bar Charts & PictogramsTry yourself: What is the purpose of using a bar chart?View Solution
The document Bar Charts & Pictograms | Mathematics for GCSE/IGCSE - Class 10 is a part of the Class 10 Course Mathematics for GCSE/IGCSE.
All you need of Class 10 at this link: Class 10
|
66 videos|674 docs|19 tests
|
FAQs on Bar Charts & Pictograms - Mathematics for GCSE/IGCSE - Class 10
| 1. What is the difference between a bar chart and a pictogram? |  |
Ans. A bar chart represents data using rectangular bars of different lengths, while a pictogram uses pictures or symbols to represent data.
| 2. How can a bar chart be used to compare different categories or groups of data? |  |
Ans. A bar chart visually displays the data for each category or group using bars of varying lengths, making it easy to compare the values among different categories.
| 3. What are some advantages of using a pictogram to represent data? |  |
Ans. Pictograms are visually appealing and can make data easier to understand for those who may have difficulty interpreting numerical data. They can also help in making data more engaging and memorable.
| 4. How can one ensure that a bar chart or pictogram is accurately representing the data? |  |
Ans. To ensure accuracy, one should check that the scale on the chart is clearly labeled, that the bars or pictures accurately represent the data values, and that the chart is properly labeled and titled.
| 5. In what situations would it be more appropriate to use a bar chart over a pictogram, and vice versa? |  |
Ans. Bar charts are typically used when precise numerical data needs to be compared, while pictograms are more suitable for representing data in a more visual and engaging way, especially when dealing with simpler data sets.
Related Searches


