
Best Study Material for Year 11 Exam
Year 11 Exam > Year 11 Notes > Mathematics for GCSE/IGCSE > Histograms
Histograms | Mathematics for GCSE/IGCSE - Year 11 PDF Download
Frequency Density
What is frequency density?
- Frequency density is calculated using the formula:
- Frequency density = frequency / class width
- It is used with grouped data (class intervals).
- Frequency density is particularly useful for class intervals of unequal width.
- It measures how spread out data within a class interval is, relative to its size.
- Example:
- 10 data values over a class interval of 20:
- Frequency density = 10 / 20 = 1/2
- 20 data values over a class interval of 100:
- Frequency density = 20 / 100 = 1/5
- 10 data values over a class interval of 20:
- Since 1/2 is greater than 1/5, the data in the first interval is more densely spread (closer together) than in the second interval, even though the second interval has more data values.
How do I calculate frequency density?
- Questions typically present grouped data in a table.
- Add two extra columns to this table:
- One column for calculating and recording the class width of each interval.
- A second column for calculating the frequency density for each group (row).
Drawing Histograms
What is a Histogram?
- Histograms are not just really hard bar charts; they serve a distinct purpose.
- Unlike bar charts which handle discrete and non-numerical data, histograms are designed for continuous data, often organized in uneven class intervals.
- In a bar chart, frequency is determined by height or length, while in a histogram, it's the area of a bar that signifies the frequency.
- The frequency of a class interval is directly linked to the area of the bar representing that interval.
- Merely glancing at a histogram doesn't reveal much; one needs to perform basic calculations for meaningful conclusions and comparisons.
 |
Download the notes
Histograms
|
Download as PDF |
Download as PDF
How do I draw a histogram?
- To draw a histogram, first calculate the frequency densities for each class interval (group).
- Most questions will require you to complete an incomplete histogram rather than starting from scratch.
- Since frequency is proportional to frequency density:
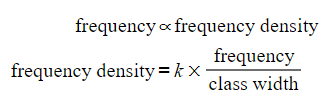
- In most cases, k = 1, so the proportionality can be ignored.
- Once the frequency densities are calculated:
- Draw bars (rectangles) with widths measured on the horizontal (x) axis.
- The height of each bar represents the class's frequency density and is measured on the vertical (y) axis.
- As the data is continuous, the bars will be touching.
Question for Histograms
Try yourself:
What is the formula for calculating frequency density?View Solution
Interpreting Histograms
 |
Take a Practice Test
Test yourself on topics from Year 11 exam
|
Practice Now |
Practice Now
How do I interpret a histogram?
- The frequency density (y-) axis does not indicate frequency directly.
- The area of the bar is proportional to the frequency.
- Frequency is determined by the area of the bar using:
- Frequency = area
- To estimate the frequency of part of a bar/class interval within a histogram:
- Find the area of the required part of the interval.
- Use the area to calculate the frequency as described above.
The document Histograms | Mathematics for GCSE/IGCSE - Year 11 is a part of the Year 11 Course Mathematics for GCSE/IGCSE.
All you need of Year 11 at this link: Year 11
|
84 videos|120 docs
|


FAQs on Histograms - Mathematics for GCSE/IGCSE - Year 11
| 1. What is frequency density in the context of histograms? |  |
| 2. How can histograms be drawn to represent data effectively? | |
Ans. To draw a histogram, you need to first determine the intervals or bins you will use to group your data. Then, you plot the frequency of data points within each interval as bars on a graph, with the height of each bar representing the frequency density.
| 3. How can histograms be interpreted to understand the distribution of data? | |
Ans. By looking at the shape of a histogram, you can determine if the data is skewed to the left or right, if it is symmetric, or if it follows a particular pattern. Additionally, you can analyze the spread and central tendency of the data based on the histogram.
| 4. What is the difference between frequency and frequency density in histograms? | |
Ans. Frequency in histograms refers to the actual count of data points within an interval, while frequency density takes into account the width of the interval to provide a more accurate representation of how data is distributed within each interval.
| 5. How can histograms be used to compare different data sets? | |
Ans. Histograms can be used to visually compare the distribution of data in different sets by plotting them on the same graph. This allows for easy comparison of the shape, spread, and central tendency of the data sets.
Related Exams
About this Document

Apr 07, 2025
Last updated
Document Description: Histograms for Year 11 2025 is part of Mathematics for GCSE/IGCSE preparation.
The notes and questions for Histograms have been prepared according to the Year 11 exam syllabus. Information about Histograms covers topics
like Frequency Density, Drawing Histograms, Interpreting Histograms and Histograms Example, for Year 11 2025 Exam. Find important definitions, questions, notes, meanings, examples, exercises and tests below for Histograms.
Introduction of Histograms in English is available as part of our Mathematics for GCSE/IGCSE
for Year 11 & Histograms in Hindi for Mathematics for GCSE/IGCSE course.
Download more important topics related with notes, lectures and mock test series for Year 11
Exam by signing up for free. Year 11: Histograms | Mathematics for GCSE/IGCSE - Year 11
Description
Full syllabus notes, lecture & questions for Histograms | Mathematics for GCSE/IGCSE - Year 11 - Year 11 | Plus excerises question with solution to help you revise complete syllabus for Mathematics for GCSE/IGCSE | Best notes, free PDF download
Information about Histograms
In this doc you can find the meaning of Histograms defined & explained in the simplest way possible. Besides explaining types of
Histograms theory, EduRev gives you an ample number of questions to practice Histograms tests, examples and also practice Year 11
tests

Related Searches
Previous Year Questions with Solutions
,shortcuts and tricks
,Viva Questions
,Histograms | Mathematics for GCSE/IGCSE - Year 11
,Summary
,past year papers
,video lectures
,study material
,Objective type Questions
,Histograms | Mathematics for GCSE/IGCSE - Year 11
,ppt
,Sample Paper
,MCQs
,Free
,Important questions
,Extra Questions
,practice quizzes
,Histograms | Mathematics for GCSE/IGCSE - Year 11
,Semester Notes
,mock tests for examination
,Exam
;


Additional Information about Histograms for Year 11 Preparation
Histograms Free PDF Download
The Histograms is an invaluable resource that delves deep into the core of the Year 11 exam.
These study notes are curated by experts and cover all the essential topics and concepts, making your preparation more efficient and effective.
With the help of these notes, you can grasp complex subjects quickly, revise important points easily,
and reinforce your understanding of key concepts. The study notes are presented in a concise and easy-to-understand manner,
allowing you to optimize your learning process. Whether you're looking for best-recommended books, sample papers, study material,
or toppers' notes, this PDF has got you covered. Download the Histograms now and kickstart your journey towards success in the Year 11 exam.
Importance of Histograms
The importance of Histograms cannot be overstated, especially for Year 11 aspirants.
This document holds the key to success in the Year 11 exam.
It offers a detailed understanding of the concept, providing invaluable insights into the topic.
By knowing the concepts well in advance, students can plan their preparation effectively.
Utilize this indispensable guide for a well-rounded preparation and achieve your desired results.
Histograms Notes
Histograms Notes offer in-depth insights into the specific topic to help you master it with ease.
This comprehensive document covers all aspects related to Histograms.
It includes detailed information about the exam syllabus, recommended books, and study materials for a well-rounded preparation.
Practice papers and question papers enable you to assess your progress effectively.
Additionally, the paper analysis provides valuable tips for tackling the exam strategically.
Access to Toppers' notes gives you an edge in understanding complex concepts.
Whether you're a beginner or aiming for advanced proficiency, Histograms Notes on EduRev are your ultimate resource for success.
Histograms Year 11 Questions
The "Histograms Year 11 Questions" guide is a valuable resource for all aspiring students preparing for the
Year 11 exam. It focuses on providing a wide range of practice questions to help students gauge
their understanding of the exam topics. These questions cover the entire syllabus, ensuring comprehensive preparation.
The guide includes previous years' question papers for students to familiarize themselves with the exam's format and difficulty level.
Additionally, it offers subject-specific question banks, allowing students to focus on weak areas and improve their performance.
Study Histograms on the App
Students of Year 11 can study Histograms alongwith tests & analysis from the EduRev app,
which will help them while preparing for their exam. Apart from the Histograms,
students can also utilize the EduRev App for other study materials such as previous year question papers, syllabus, important questions, etc.
The EduRev App will make your learning easier as you can access it from anywhere you want.
The content of Histograms is prepared as per the latest Year 11 syllabus.
|
© EduRev
|
Education Revolution
|


|


Signup to see your scores
go up
within 7 days!
within 7 days!
Takes less than 10 seconds to signup