Class 5 Exam > Class 5 Notes > Year 5 Science > Recording and presenting data
Recording and presenting data | Year 5 Science - Class 5 PDF Download
Choosing the Right Presentation Method for Data
Science experiments produce results that can be presented in various formats, such as:
- Drawings and Photographs: Visual representations like drawings or photographs are invaluable for showcasing data that lacks numerical values. For instance, observations of natural phenomena, such as seasonal changes, or the discovery of a new cell type, are best depicted through images. Scientific diagrams, distinct from artistic ones, are straightforward and devoid of shading.
- Bar Charts: Bar charts are ideal for illustrating discrete data—information that can be expressed in whole numbers. They are versatile in presenting data where the order is not crucial, such as colors displayed in any sequence. Similarly, pie charts are effective for displaying such non-sequential results.
- Line Graphs: Line graphs excel at representing continuous data—data that spans a range of values, which may not be whole numbers, like height and weight. These graphs necessitate a specific order in their presentation, such as time progressing from one minute to five minutes.
- Scatter Graphs: Scatter graphs are utilized in pattern-seeking inquiries to reveal relationships between two distinct variables. They are particularly useful for identifying patterns in data sets.
- Scientific Publications: Scientists document their research findings in concise articles published in journals, which serve as essential repositories of scientific knowledge.
Examples of Presenting Data
- Results from experiments are commonly displayed in tables and illustrated in charts and graphs to enhance comprehension.
- Three instances focusing on eye color, reactions, age, and heart rate are provided.
Example 1: Sol:
Sol: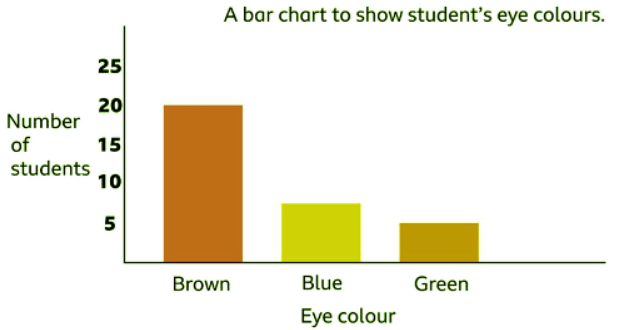
Example 2: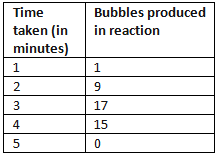 Sol:
Sol: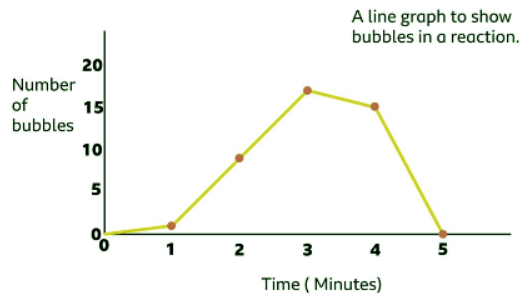
Example 3: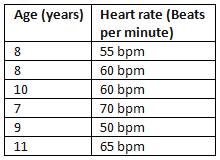 Sol:
Sol: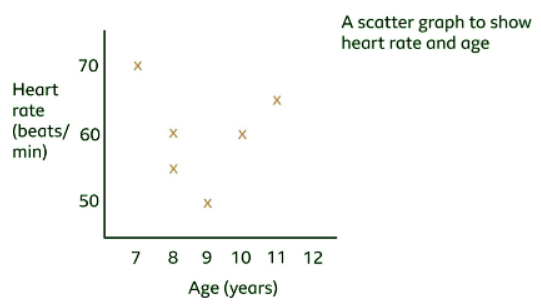
The document Recording and presenting data | Year 5 Science - Class 5 is a part of the Class 5 Course Year 5 Science.
All you need of Class 5 at this link: Class 5
|
19 videos|34 docs|12 tests
|
FAQs on Recording and presenting data - Year 5 Science - Class 5
| 1. How do UK schools record and present data? |  |
Ans. UK schools record and present data through various methods such as examination results, attendance records, behavior logs, and academic progress reports. They use software systems to input and analyze data to track student performance and make informed decisions.
| 2. What are some common data points that UK schools collect and analyze? |  |
Ans. Some common data points that UK schools collect and analyze include student grades, attendance rates, standardized test scores, behavior incidents, demographic information, and academic progress over time. This data helps schools identify areas for improvement and track student performance.
| 3. How do UK schools ensure the accuracy and confidentiality of the data they collect? |  |
Ans. UK schools have strict protocols in place to ensure the accuracy and confidentiality of the data they collect. This includes using secure databases, limiting access to sensitive information, obtaining consent from students and parents to collect data, and following data protection laws such as the GDPR.
| 4. How do UK schools use data to improve student outcomes and educational practices? |  |
Ans. UK schools use data to identify trends and patterns in student performance, create targeted interventions for struggling students, track progress towards academic goals, and evaluate the effectiveness of educational programs. This data-driven approach helps schools make informed decisions to improve student outcomes.
| 5. What role does data analysis play in the assessment and evaluation of UK schools? |  |
Ans. Data analysis plays a crucial role in assessing and evaluating UK schools by providing insights into student performance, teacher effectiveness, resource allocation, and overall school improvement. Schools use data to measure progress, set goals, and make evidence-based decisions to enhance educational practices.
Related Searches


