Understanding Break Even Analysis | Industrial Engineering - Mechanical Engineering PDF Download
Break-even analysis is a crucial economic tool used to determine the point at which a company begins to generate a profit. It helps businesses calculate the number of products that must be sold to cover all initial investment costs. Reaching the break-even point indicates that a company is no longer operating at a loss.
What is the Break-Even Point?
In business, the break-even point is when total expenses equal total revenue. Achieving this point means a business has covered all its costs and is no longer incurring losses.
Given the importance of this calculation, it is essential for businesses to learn and accurately determine their break-even points.
To understand this better, consider the following formula:
Where:
Fixed Cost: Costs that do not change with the level of production, such as rent, loans, and insurance premiums.
Variable Cost: Costs that vary with the production volume, such as the cost to produce one unit of product.
Example
Let's clarify this with an example:
A factory, ABC Enterprises, produces a product with total fixed costs of Rs. 50,000 and a variable cost of Rs. 30 per unit. The sale price per unit is Rs. 50.
Using the formula:
This means that ABC Enterprises needs to sell at least 2500 units to cover both fixed and variable production costs.
To determine total sales at the break-even point, multiply the break-even point by the sale price per unit:
Total Sales = 2500 × 50 = Rs.1,25,000
Therefore, the total sales made by the company at the break-even point will be Rs. 1,25,000.
Numerical to Solve
A company produces goods at a variable cost of Rs.12 per unit, and the same is sold at Rs.20 per unit. Fixed cost incurred by a company for a period stands at Rs.40,000. Calculate the number of products a company needs to manufacture to attain a profit target of Rs.10,000.
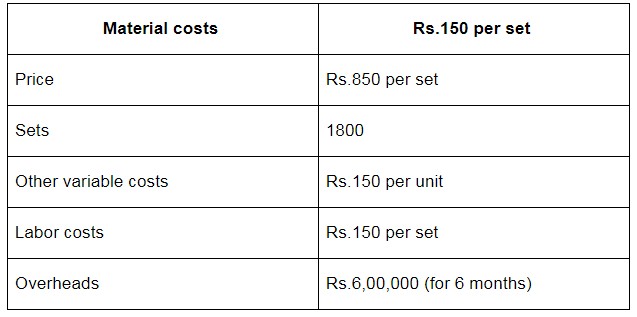
Check the following table to know about cost analysis for 6 months of a business operation.

- Calculate the breakeven quantity
- Draw break-even chart for the 6 months of business operation
- Determine the profit earned by an organization
Fixed costs of an enterprise is Rs.3,00,000, and the variable cost and selling price of the product is Rs.42 per unit and Rs.72 per unit, respectively. The company expects to sell 15,000 units of the product whereas it has a maximum factory capacity of 20,000 units. Draw a break-even chart depicting the break-even point and determine the profit earned at this current situation.
Students can solve these numerical quickly and accurately after they have a thorough understanding of the concept of break-even analysis. To understand why we need to calculate this, look at its importance in detail.
Significance of Break-Even Analysis
Determining the Volume of Products to be Sold
- Break-even analysis helps companies determine the minimum number of units that must be sold to cover both fixed and variable production costs. This provides a clear target for the number of units needed to avoid losses.
Budgeting and Target Setting
- By understanding the operational scenario through break-even analysis, businesses can plan budgets for various operations more effectively. Additionally, it allows them to set achievable production targets to drive business growth.
Cost Control
- Both fixed and variable costs affect an organization's profit margins. Break-even analysis enables businesses to assess the impact of these costs and identify areas where cost control is necessary to maintain profitability.
Pricing Strategy Design
- Product pricing significantly influences the break-even point. For instance, increasing the price of goods will lower the break-even point. If a company needed to sell 50 units to break even, increasing the price might reduce this requirement to 45 units.
Margin of Safety Management
- In times of financial crisis or market downturns, sales may decline. Break-even analysis helps manage the margin of safety by indicating the minimum number of units needed to avoid losses.
The margin of safety can be calculated using the following formulas: or
or
These points highlight the importance of calculating and analyzing break-even points in a business environment.
Components of Break-Even Analysis
Fixed Cost
- Fixed costs, also known as overhead costs, do not vary with production volume. Examples include salaries, rent, insurance premiums, loans, and utility bills.
Variable Cost
- Variable costs fluctuate with the number of units produced. Examples include costs of fuel, raw materials, and packaging.
Applications of Break-Even Analysis
Planning for New Businesses
- New businesses have extensive planning to do before launching a facility and beginning production. Break-even analysis is crucial in ensuring accurate cost and pricing plans for goods. It helps assess whether the new business idea will be viable and productive.
Introduction of New Products
- When a company plans to introduce new products, break-even analysis becomes highly significant. Analyzing the break-even point before production begins helps understand the costs and pricing strategy needed for the new products.
Modifying Business Models
- Changes in a business model can impact productivity and costs. Break-even analysis helps determine whether changes in the model will affect expenses and, if so, guides adjustments to the selling price. Analyzing the break-even point in such scenarios is both feasible and essential.
Additionally, terms like marginal costing and break-even analysis often appear together. Marginal cost refers to the extra cost incurred in producing one additional unit of a product, which helps determine how variable costs affect production volume.
Understanding break-even analysis will give students a comprehensive view of this economic concept. For in-depth study material, students can visit Vedantu's official website or download the app for access to expertly prepared study notes that cover the nuances of the subject intricately.
Break-even analysis is an essential economic tool used to determine a company's cost structure or the number of units/services needed to cover expenditures. It defines a condition where the company neither makes a profit nor incurs a loss but recovers all money spent on product development.
This analysis examines the relationship between fixed costs, variable costs, and revenue. Typically, a company with low fixed costs will have a low break-even point of sale.
Importance of Break-Even Analysis
Determining the Volume of Units to be Sold
- Break-even analysis helps a company determine the number of units that need to be sold to cover costs. It requires knowing the variable cost and selling price per unit along with the total cost.
Budgeting and Setting Targets
- It allows a company to set a budget, establish goals, and work towards them, knowing the break-even point. This helps in setting achievable targets.
Managing the Margin of Safety
- In times of financial downturns, break-even analysis helps determine the minimum number of sales needed to avoid losses. Margin of safety reports assist management in making informed business decisions.
Monitoring and Controlling Costs
- Fixed and variable costs can affect profit margins. Break-even analysis helps management detect changes in costs and take necessary actions.
Designing Pricing Strategies
- If the selling price of a product increases, the break-even quantity decreases, and vice versa. Thus, break-even analysis aids in designing effective pricing strategies.
Components of Break-Even Analysis
Fixed Costs
- Also known as overhead costs, these include expenses that do not vary with production volume, such as taxes, salaries, rent, depreciation, labor costs, interest, and energy costs.
Variable Costs
- These costs vary with production volume and include packaging, raw materials, fuel, and other production-related materials.
Applications of Break-Even Analysis
- New Business Ventures: For new ventures, break-even analysis is essential in evaluating the productivity and feasibility of the business idea. It helps in formulating practical cost and pricing strategies.
- Launching New Products: Before launching a new product, a company needs to conduct a break-even analysis to understand the additional expenditures and ensure the product is financially viable.
- Business Model Changes: Break-even analysis helps determine necessary pricing adjustments when changing business models, such as shifting from retail to wholesale.
Break-Even Analysis Formula
Break-even point = Fixed cost/-Price per cost – Variable cost
Solved Example
Example 1: A com pany m anufactures pocket transistors. The details of its m onthly expenditure are as follow:
Direct material - ₹10000
Direct labour - 200 hours at the rate of ₹5 per hour
125 hours at the rate of ₹4 per hour
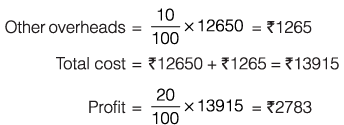
Applied overheads (factory overheads) = 10% of prime cost
Other overheads = 10% of works cost
Profit = 20% of total cost
Number of units manufactured per month = 200
Estimate the selling price unit.
Sol:
Prime cost = Cost of direct material + Cost of direct labour + Direct expenses
= 10000 + 200 x 5 + 125 x 4 = 711500
Works cost (Factory cost) = Prime cost + Factory overheads
= 11500 + 1150 = ₹12650
Selling price for 200 units = 13915 + 2783 = ₹16698
Example 2: A standard m achine tool and an autom atic m achine tool are being com pared for the component. Following data refers to the two machines.
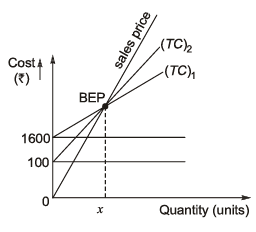
What is the breakeven production batch size above which the automatic machine tool will be economical to use?
Sol: Total cost of x1 component by using standard machine tool
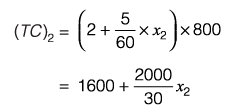
Total cost x2 component by using automatic machine tool.
Let break even quantity be x.
At break even point,
(TC)1 = (TC)2
∴ 
or 6.667x = 1500
∴ x = 225
|
30 videos|64 docs|30 tests
|
FAQs on Understanding Break Even Analysis - Industrial Engineering - Mechanical Engineering
| 1. What is the Break-Even Point? |  |
| 2. What is the significance of Break-Even Analysis? |  |
| 3. What are the components of Break-Even Analysis? |  |
| 4. What are the applications of Break-Even Analysis? |  |
| 5. Why is Break-Even Analysis important in Mechanical Engineering? |  |


