Tools for Analysis of Financial Statements | Crash Course for UGC NET Commerce PDF Download
Financial Statements - Meaning
Financial statements are formal records that detail the financial activities and position of a business, individual, or other entity. They provide a summary of an organization's financial transactions, performance, and overall financial status over a specific period. These statements are essential for assessing a business's financial health and performance, serving as crucial tools for management, investors, creditors, and regulatory authorities.
Financial Statement Analysis
- Financial statement analysis involves the process of reviewing and evaluating a company's financial statements to support informed business decisions.
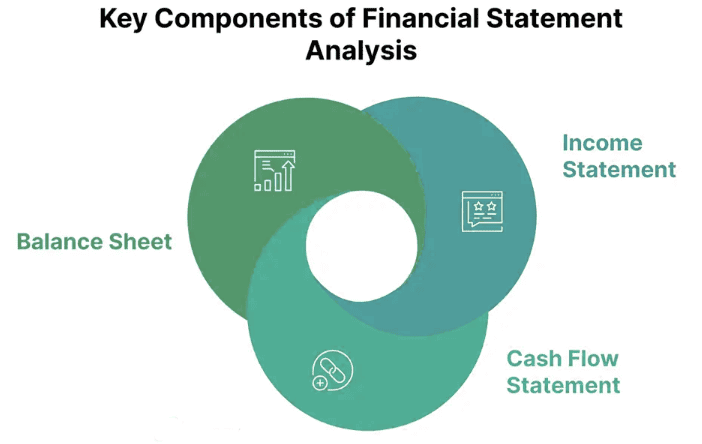
- This analysis assesses the financial health, performance, and position of an organization by examining elements within its income statement, balance sheet, and cash flow statement.
- The primary goal is to extract valuable insights that guide investors, creditors, management, and other stakeholders in their decision-making.
Key Aspects of Financial Statement Analysis

Here are the key aspects of financial statement analysis:
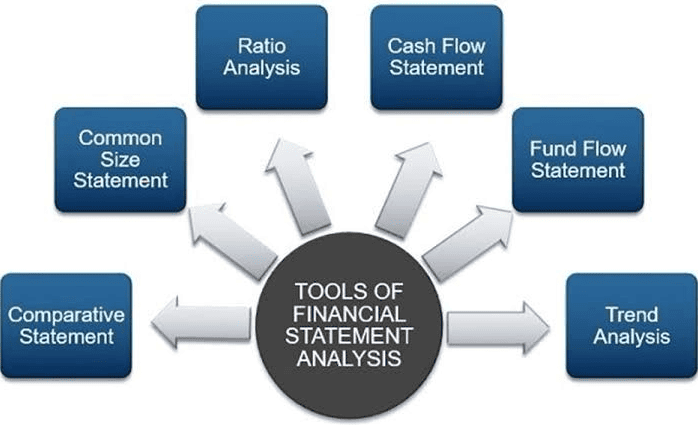
Common Tools and Techniques: Analysts use various methods, including horizontal analysis, vertical analysis, ratio analysis, and trend analysis, to interpret financial statements.
Horizontal Analysis: This technique compares financial data across multiple periods to identify trends, changes, and growth rates, helping to assess the company's performance over time.
Vertical Analysis: In this approach, each line item is expressed as a percentage of a base item (such as total revenue or total assets), offering insights into the composition and structure of the financial statements.
Ratio Analysis: This involves calculating and interpreting financial ratios to measure various aspects of a company's performance, including liquidity, profitability, solvency, and efficiency.
Trend Analysis: This method examines the direction and consistency of financial statement items over several periods, helping to identify long-term patterns and potential concerns.
Comparative Analysis: This involves comparing a company's financial performance with industry benchmarks, competitors, or its historical performance to evaluate its relative strengths and weaknesses.
Cash Flow Analysis: This analysis evaluates a company's ability to generate and manage cash by examining the cash flow statement, providing insights into liquidity and the sustainability of operations.
Risk Assessment: Financial statement analysis helps assess different types of risks, including financial, operational, and market risks, aiding stakeholders in making informed investment and credit decisions.
Decision-Making: Investors, creditors, management, and other stakeholders use financial statement analysis to inform decisions related to investments, credit extensions, strategic planning, and overall financial management.
Tools and Techniques of Financial Statement Analysis

Various tools and techniques are employed in financial statement analysis to interpret and evaluate a company's financial health, performance, and position. Some common methods include:
- Horizontal Analysis: This compares financial data over multiple periods to identify trends, changes, and growth rates, aiding in assessing the company's performance over time.
- Vertical Analysis: This technique expresses each line item as a percentage of a base item (like total revenue or total assets) to analyze the relative composition of financial statements.
- Ratio Analysis: Involves calculating and interpreting financial ratios that measure different performance aspects, such as liquidity, profitability, solvency, and efficiency, providing a comprehensive analysis.
- Common Size Financial Statements: This method expresses each line item as a percentage of a common base, making it easier to compare financial statements of companies of varying sizes, facilitating standardized comparison and identifying relative proportions.
- Trend Analysis: Examines the direction and consistency of financial statement items over multiple periods, helping predict future trends and identify potential areas of concern or improvement.
- Comparative Analysis: Compares a company's financial performance with industry benchmarks, competitors, or its historical performance, providing a benchmark for assessing relative strengths and weaknesses.
- Cash Flow Analysis: Evaluates a company's ability to generate and manage cash by analyzing the cash flow statement, offering insights into liquidity, operating activities, and sustainability.
- DuPont Analysis: This technique breaks down return on equity (ROE) into components such as profitability, asset turnover, and financial leverage, helping identify the drivers of a company's ROE and areas for improvement.
- Earnings Quality Analysis: Assesses the sustainability and reliability of reported earnings, helping identify potential accounting irregularities and providing insights into the quality of reported financial results.
- Forecasting Models: Utilizes historical financial data to create models for predicting future financial performance, aiding in long-term planning, budgeting, and strategic decision-making.
- Risk Assessment Techniques: Analyzes various risks, including financial, operational, and market risks, assisting in identifying and managing potential risks that may impact the company's financial position.
- Scenario Analysis: Evaluates the impact of different scenarios or events on financial statements, helping assess the sensitivity of financial results to changes in various factors.
These tools and techniques are often used in combination to conduct a thorough financial statement analysis, providing a comprehensive view of a company's financial performance and helping stakeholders make informed decisions.
Application of Statistical Tools in Financial Statement Analysis
Statistical tools are extensively utilized in financial statement analysis to derive meaningful insights from large datasets, identify patterns, and support informed decision-making. Below are some specific applications of statistical tools in this context:
Regression Analysis:
- Application: Investigating the relationship between one or more independent variables (e.g., revenue, expenses, or economic indicators) and a dependent variable (such as net income).
- Purpose: To identify and quantify the impact of various factors on financial performance, aiding in prediction and decision-making.
Time Series Analysis:
- Application: Analyzing financial data over time to identify trends, patterns, and seasonality.
- Purpose: To forecast future financial performance based on historical patterns and to understand the timing of financial events.
Correlation Analysis:
- Application: Measuring the degree of association between two financial variables (e.g., revenue and marketing expenses).
- Purpose: To understand the relationships between different financial elements and to identify potential areas of influence.
Variance Analysis:
- Application: Analyzing the differences between budgeted and actual financial figures.
- Purpose: To identify the causes of variations, whether due to operational inefficiencies or changes in external factors, and to guide corrective actions.
Monte Carlo Simulation:
- Application: Simulating various scenarios and their impact on financial outcomes by considering multiple variables and uncertainties.
- Purpose: To assess the range of possible financial outcomes and their associated probabilities, aiding in risk management and decision-making.
Cluster Analysis:
- Application: Grouping companies based on similarities in financial performance.
- Purpose: To identify peer groups for benchmarking and industry comparisons and to reveal commonalities among companies.
Factor Analysis:
- Application: Identifying underlying factors that contribute to variations in financial data.
- Purpose: To reduce complexity by grouping correlated financial variables into common factors, aiding in the interpretation of financial performance.
Probability Distributions:
- Application: Assessing the probability of different financial outcomes.
- Purpose: To understand the likelihood of various financial scenarios and to make risk-informed decisions.
Hypothesis Testing:
- Application: Testing hypotheses about financial relationships or the effectiveness of financial strategies.
- Purpose: To draw conclusions and make inferences based on statistical significance, guiding decision-making processes.
Panel Data Analysis:
- Application: Analyzing financial data for multiple entities over time.
- Purpose: To identify trends, patterns, and variations across different entities and periods, facilitating comprehensive analysis.
Descriptive Statistics:
- Application: Summarizing and describing key characteristics of financial data, such as mean, median, and standard deviation.
- Purpose: To provide a concise overview of the central tendencies and variability in financial variables.
Conclusion
The tools used in financial statement analysis are crucial for evaluating a company's financial health and performance. By employing techniques such as horizontal analysis, vertical analysis, ratio analysis, common size financial statements, and trend analysis, stakeholders can gain a thorough understanding of the company's financial position. These tools form the foundation for strategic decision-making, risk assessment, and the development of effective financial strategies.
|
157 videos|236 docs|166 tests
|
FAQs on Tools for Analysis of Financial Statements - Crash Course for UGC NET Commerce
| 1. What is the importance of financial statements in financial statement analysis? |  |
| 2. What are some key aspects to consider when analyzing financial statements? |  |
| 3. What are some common tools and techniques used in financial statement analysis? |  |
| 4. How can statistical tools be applied in financial statement analysis? |  |
| 5. How can UGC NET help in providing resources for the analysis of financial statements? |  |


