Measures of Dispersion: Meaning, Types & Formulas | Crash Course for UGC NET Commerce PDF Download
Introduction
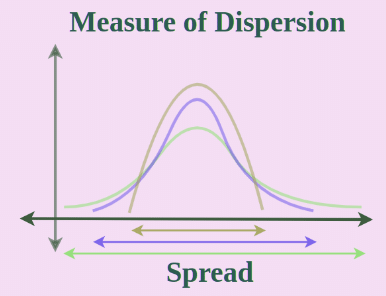
Measures of dispersion are used to describe the spread of data. They provide numerical indicators of how data points vary across different parameters, illustrating the extent of variability within a dataset.

Dispersion in Statistics
- Dispersion in statistics refers to the extent to which data points are spread out around an average value. It provides insight into how clustered or dispersed the data is.
- Dispersion illustrates the variability or consistency within a data set. Key measures of dispersion include range, variance, and standard deviation.
Measures of Dispersion
These measures quantify how data values are distributed within a data set. They are essential for understanding the variation between different values in the data.
Types of Measures of Dispersion
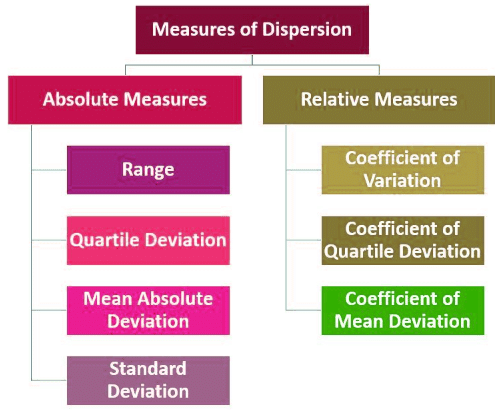
Measures of dispersion fall into two main categories:
- Absolute Measures of Dispersion
- Relative Measures of Dispersion
Each type of measure has distinct parameters, and these parameters are expressed in the same units as the data.
Absolute Measure of Dispersion
Absolute measures of dispersion are expressed in the same units as the data itself, such as meters, dollars, kilograms, etc. These measures include:
- Range: The difference between the largest and smallest values in the data set.
- Mean Deviation: The average of the absolute differences between each value and the mean of the data set.
- Standard Deviation: The square root of the average of the squared deviations from the mean.
- Variance: The average of the squared deviations from the mean in the data set.
- Quartile Deviation: Half the difference between the third quartile (Q3) and the first quartile (Q1).
- Interquartile Range: The difference between the upper quartile (Q3) and the lower quartile (Q1), calculated as Q3 – Q1.
Relative Measure of Dispersion
Relative measures of dispersion are used to compare the dispersion of data sets with different units, providing a clearer understanding of data variability.
Here are some relative measures of dispersion:
- Coefficient of Range: The ratio of the difference between the highest and lowest values in a data set to the sum of these two values.
- Coefficient of Variation: The ratio of the standard deviation to the mean of the data set, typically expressed as a percentage.
- Coefficient of Mean Deviation: The ratio of the mean deviation to the value of the central point (mean) of the data set.
- Coefficient of Quartile Deviation: The ratio of the difference between the third quartile (Q3) and the first quartile (Q1) to the sum of these two quartiles.
Range of a Data Set
The range measures the difference between the largest and smallest values in a data set and is calculated as:
R=L−S
where:
- L is the largest value in the data set
- S is the smallest value in the data set
A higher range indicates greater variability in the data. However, one limitation of the range is that it only considers the maximum and minimum values, which may not always reflect the true dispersion of the data.
Example: Find the range of the data set 10, 20, 15, 0, 100.
Sol:
Smallest Value in the data = 0
Largest Value in the data = 100
Thus, the range of the data set is,
R = 100 – 0
R = 100
Note: Range cannot be calculated for the open-ended frequency distributions. Open-ended frequency distributions are those distributions in which either the lower limit of the lowest class or the higher limit of the highest class is not defined.
Range for Ungrouped Data
To determine the range for ungrouped data, we start by identifying the smallest and largest values within the dataset. The range is calculated by finding the difference between these two values.
Example: Find out the range for the following observations, 20, 24, 31, 17, 45, 39, 51, 61.
Sol:
- Largest Value: 61
- Smallest Value: 17
Therefore, the range of this data set is:
Range = 61 - 17 = 44
Range for Grouped Data
Calculating the range for grouped data involves a different approach.
Example: Find out the range for the following frequency distribution table for the marks scored by class 10 students.
Sol:
For Largest Value: Taking the higher limit of Highest Class = 40
For Smallest Value: Taking the lower limit of Lowest Class = 0
Range = 40 – 0
Thus, the range of the given data set is,
Range = 40
Mean Deviation
Mean deviation is a measure that indicates how much the observations in a dataset differ from the mean of that dataset. Since some deviations are positive and some are negative, adding them directly might offset each other, leading to misleading results.
For example, let's consider the data set: -5, 10, 25
Mean = (-5 + 10 + 25)/3 = 10
Now, the deviations from the mean for each value are:
- (-5 - 10) = -15
- (10 - 10) = 0
- (25 - 10) = 15
Simply adding these deviations would yield zero, which is inaccurate. To address this, only the absolute values of these differences are considered when calculating mean deviation.
Mean Deviation Formula:

Mean Deviation for Ungrouped Data
To calculate mean deviation for ungrouped data, follow these steps:
- Calculate the arithmetic mean for all values in the dataset.
- Find the absolute difference between each value and the mean.
- Calculate the arithmetic mean of these absolute deviations using the formula:

This can be explained using the example.
Example: Calculate the mean deviation for the given ungrouped data, 2, 4, 6, 8, 10
Sol:
Mean(μ) = (2+4+6+8+10)/(5)
μ = 6

⇒ M.D = (4+2+0+2+4)/(5)
⇒ M.D = 12/5 = 2.4
Measures of Dispersion Formula
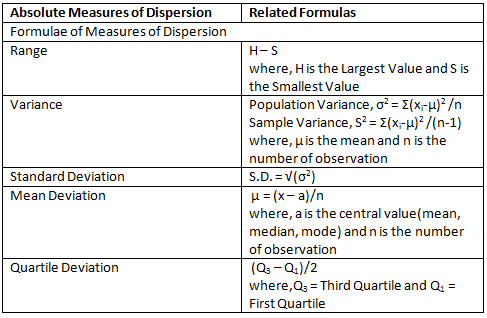
Measures of Dispersion Formulas help us understand different aspects of data variability. These formulas provide insights into the spread of data points. Below are some key formulas related to measures of dispersion:

Coefficient of Dispersion
The Coefficient of Dispersion (C.D.) is a useful metric when comparing two datasets that have significant differences in their averages or when dealing with data measured in different units. This coefficient is denoted by C.D.

Measures of Dispersion and Central Tendency
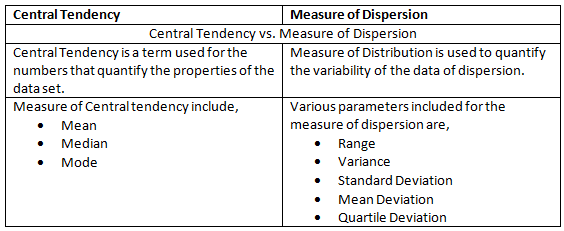
Both Measures of Dispersion and Central Tendency are numerical values that help in understanding different aspects of data. Let's explore the disparities between Measures of Dispersion and Central Tendency.

|
157 videos|236 docs|166 tests
|
FAQs on Measures of Dispersion: Meaning, Types & Formulas - Crash Course for UGC NET Commerce
| 1. What is dispersion in statistics? |  |
| 2. What are the different measures of dispersion? |  |
| 3. What is the mean deviation as a measure of dispersion? |  |
| 4. How is the coefficient of dispersion calculated? |  |
| 5. How do measures of dispersion relate to measures of central tendency? |  |


