Skewness: Measures | Crash Course for UGC NET Commerce PDF Download
| Table of contents |
|
| What is Skewness? |
|
| Assessing Skewness in Data |
|
| Types of Skewness |
|
| Measurement of Skewness |
|
| Interpreting Skewness |
|

What is Skewness?
Skewness can be defined as a statistical measure that describes the lack of symmetry or asymmetry in the probability distribution of a dataset. It quantifies the degree to which the data deviates from a perfectly symmetrical distribution, such as a normal (bell-shaped) distribution. Skewness is a valuable statistical term because it provides insight into the shape and nature of a dataset's distribution. For example, understanding whether a dataset is positively or negatively skewed can be important in various fields, including finance, economics, and data analysis, as it can impact the interpretation of data and the choice of statistical techniques.
Assessing Skewness in Data
To determine the skewness of a dataset, several statistical tests and methods can be utilized. These approaches help identify whether a dataset exhibits positive skewness, negative skewness, or is approximately symmetric. Here are some common techniques:
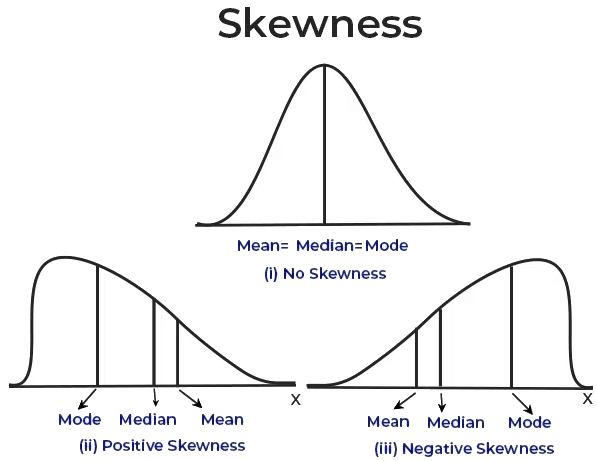
Visual Inspection: One of the simplest methods to evaluate skewness is by plotting a histogram or density plot of the data. If the plot shows a tail extending to the left, the distribution is negatively skewed. Conversely, if the tail extends to the right, the distribution is positively skewed. A symmetric plot suggests that the data is approximately normally distributed.
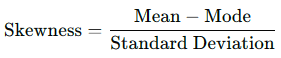
Skewness Coefficient (Pearson’s First Coefficient of Skewness): This numerical measure assesses skewness when the mean and mode are not the same. It is calculated using:
- If the mean is greater than the mode, the skewness will be positive.
- If the mean is less than the mode, the skewness will be negative.
- If the mean and mode are equal, the skewness is zero.
Quartile Measure: Skewness can also be assessed by examining the distances between quartiles:
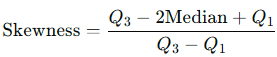 Where Q3 and Q1 represent the third and first quartiles, respectively. Positive values indicate positive skewness, while negative values indicate negative skewness.
Types of Skewness
Positive Skewness (Right Skew): In a positively skewed distribution, the right tail (larger values) is longer than the left tail (smaller values). Most data points are concentrated on the left, with some extreme values on the right. For positively skewed data:
Mean > Median > ModeExamples include income distribution (where most people earn moderate incomes but a few earn very high incomes), exam scores (where most students score within a certain range but a few score exceptionally high), and stock market returns (where most days have modest returns but a few days have very high returns).
Negative Skewness (Left Skew): In a negatively skewed distribution, the left tail (smaller values) is longer than the right tail (larger values). Most data points are clustered on the right, with a few extreme values on the left. For negatively skewed data:
Mean < Median < Mode
Examples include test scores on an easy exam (where most students score high but a few score very low), retirement age (where most people retire at a typical age but a few retire exceptionally early), and gestational age at birth (where most babies are born at full term but a few are born prematurely).Zero Skewness (Symmetrical Distribution): A distribution with zero skewness is perfectly symmetrical, meaning the mean, median, and mode are all equal. In such distributions, data points are evenly spread around the central value.
Example: A perfectly balanced dataset with equal frequencies for all values.
Measurement of Skewness
Karl Pearson’s Measure
Karl Pearson’s Measure of Skewness quantifies the asymmetry of a dataset’s distribution using its mean, median, and standard deviation. This dimensionless number provides insights into the shape and direction of the skewness in the data. It is useful across various fields of statistics and data analysis, guiding researchers and analysts in understanding the skewness, which can influence further modeling and analytical decisions.
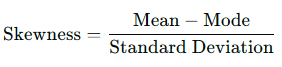
Formula for Karl Pearson’s Skewness
Skewness Calculation Using Mean and Mode:
Skewness = Mean − Mode
- If the mean is greater than the mode, the skewness is positive.
- If the mean is less than the mode, the skewness is negative.
- If the mean and mode are equal, the skewness is zero.
Coefficient of Skewness:
Based on Mean and Median:
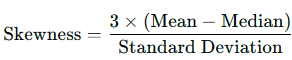
Based on Mean and Mode:
Where:
- Skewness is the Karl Pearson’s skewness coefficient.
- Mean
 is the average of the data.
 - Median (M) is the middle value of the data when ordered.
- Standard Deviation (σ) measures the data's dispersion.
Interpretation of Karl Pearson’s Skewness Coefficient:
- If Sk = 0, it indicates a perfectly symmetric distribution where the data is evenly balanced on both sides of the mean.
- If Sk > 0, it suggests a positively skewed distribution where the tail on the right side is longer or fatter, and the majority of data points are concentrated on the left side of the mean.
- If Sk < 0, it indicates a negatively skewed distribution where the tail on the left side is longer or fatter, and the majority of data points are concentrated on the right side of the mean.
Example of Karl Pearson’s Measure
Calculate Pearson’s skewness coefficient for a dataset of exam scores: 85, 88, 92, 94, 96, 98, 100, 100, 100, 100.
Sol:
Step 1: Calculation of Mean
Mean = 95.3
Step 2: Calculation of Median
Since there are 10 data points, the median is the average of the 5th and 6th values when sorted in ascending order:
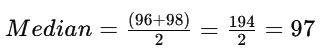
Median = 97
Step 3: Calculation of standard deviation.

Thus, σ=√26.81
σ = ~5.
Step 4: Calculation of mode
It is clear from the data set that 100 is the most frequently occurring value in the data. Hence, mode of given data is 100.
Step 5: Substitute the values in the formulae
A. With respect to Mean and Median
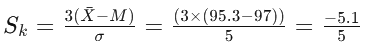
Sk = -1.02
B. With respect to Mean and Mode
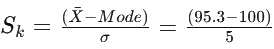
Sk = -0.94
Interpretation: The negative skewness coefficient (Sk) suggests a slight negative skew in the distribution of exam scores. This means the distribution has a longer tail on the left side, with most scores clustering on the right side of the mean.
Bowley’s Measure
Bowley’s Skewness Coefficient, named after British economist Arthur Lyon Bowley, assesses the skewness or asymmetry of a distribution using quartiles. Unlike other measures of skewness that rely on moments or deviations from the mean, Bowley’s measure uses the quartiles to provide an intuitive and straightforward understanding of skewness. This coefficient is particularly useful for analyzing datasets that may not follow a normal distribution or when a more robust measure of skewness is needed.
- Q1 is the first quartile (25th percentile),
- Q2 is the second quartile (50th percentile, or median), and
- Q3 is the third quartile (75th percentile).
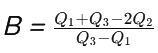
Coefficient of Bowley’s Measure
- If B = 0, the distribution is perfectly symmetric about the mean (no skewness).
- If B < 0, the distribution is negatively skewed (left-skewed), meaning the tail on the left side of the distribution is longer or heavier.
- If B > 0, the distribution is positively skewed (right-skewed), indicating that the tail on the right side of the distribution is longer or heavier.
Example of Bowley’s Measure:
Calculate Bowley’s Measure of Skewness for the following dataset representing the ages of a group of people in a sample: 20, 24, 28, 32, 35, 40, 42, 45, 50.
Sol:
Step 1: Calculate the median (Q2)
Q2= 35 (the middle value)
Step 2: Calculate the first quartile (Q1)
To find Q1, consider the values to the left of the median: 20, 24, 28, 32
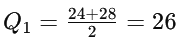
Q1 = 26
Step 3: Calculate the third quartile (Q3)
To find Q3, consider the values to the right of the median: 40, 42, 45, 50.
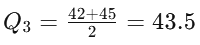
Q3 = 43.5
Step 4: Substitute the above values in the formula
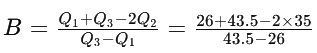
B = -0.02
Interpretation: Since B is negative (B < 0), the distribution is negatively skewed (left-skewed). This means that the tail of the distribution is longer on the left side, indicating that there may be outliers or high values on the right side of the data.
Kelly’s Measure
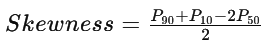
Kelly’s measure of skewness is a way to quantify the degree of skewness in a distribution by comparing the values of certain percentiles (typically the 10th, 50th, and 90th percentiles) or deciles (10th, 20th, …, 90th percentiles) of the dataset. Specifically, it involves comparing the difference between the median (50th percentile) and the average of the 10th and 90th percentiles (or deciles) to assess the skewness of the data.
Skewness as per Kelly’s Measure
Coefficient of Skewness as per Kelly’s Measure
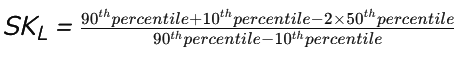
Coefficient of Kelly’s Measure
- If SKL is positive, it indicates positive skewness, meaning the distribution has a longer right tail.
- If SKL is negative, it indicates negative skewness, meaning the distribution has a longer left tail.
- If SKL is close to zero, it suggests that the distribution is approximately symmetric.
Example of Kelly’s Measure:
Calculate Kelly’s Coefficient of Skewness for the following data: 5, 7, 8, 9, 10, 12, 15, 16, 18, 20.
Sol:
Step 1: Find the 10th Percentile
To find the 10th percentile, we need to rank the data in ascending order and find the value below which 10% of the data falls. In this dataset, the 10th percentile corresponds to the value at position 1 since 10% of 10 data points is 1. So, the 10th percentile is 5.
P10 = 5
Step 2: Find the 50th Percentile (Median)
Since there are 10 data points, the median is the average of the 5th and 6th values when sorted in ascending order
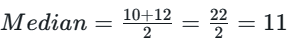
P50 = 11
Step 3: Find the 90th Percentile
To find the 90th percentile, you need to identify the value below which 90% of the data falls. In this dataset, the 90th percentile corresponds to the value at position 9 since 90% of 10 data points is 9. So, the 90th percentile is 18.
P90 = 18
Step 4: Substitute the values in the formula.
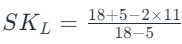
SKL = 0.07
Interpretation: A positive Kelly’s Skewness Coefficient indicates a slight positive skew in the distribution, meaning there is a longer tail on the right side. This suggests that some data points on the right are relatively larger compared to the majority of the data points.
Interpreting Skewness
Interpreting skewness involves understanding both the direction and magnitude of the skew. Here’s how to interpret skewness:
Direction of Skewness:
Negative Skewness (Left Skewed): When skewness is negative, the distribution is skewed to the left. In a left-skewed distribution:
- The left tail (with smaller values) is longer and may include outliers.
- Most data points are concentrated on the right side.
- The mean is typically less than the median.
Positive Skewness (Right Skewed): Positive skewness indicates a rightward skew. In a right-skewed distribution:
- The right tail (with larger values) is longer and may contain outliers.
- Most data points are concentrated on the left side.
- The mean is typically greater than the median.
Zero Skewness (Symmetric): A skewness value close to zero suggests a symmetric distribution, where data is evenly spread around the mean. This indicates no skewness.
Magnitude of Skewness
- Near Zero (Between -0.5 and 0.5): The distribution is approximately symmetric.
- Significantly Negative (Below -1): Indicates strong left skewness.
- Significantly Positive (Above 1): Indicates strong right skewness.
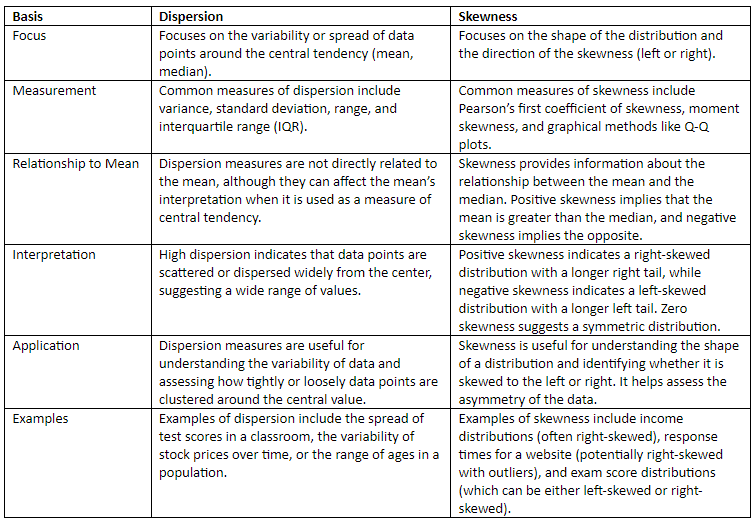
Difference between Dispersion and Skewness
Summary
Skewness is an important statistical measure that reveals the asymmetry of a distribution. It can be positive, negative, or zero, indicating the direction and extent of the skew. Skewness measures, including Pearson’s coefficients and the moment coefficient, quantify this asymmetry. Understanding and interpreting skewness is crucial for analyzing data distributions and making well-informed decisions.
|
145 videos|236 docs|166 tests
|
FAQs on Skewness: Measures - Crash Course for UGC NET Commerce
| 1. What is Skewness? |  |
| 2. How is Skewness assessed in data? | |
| 3. What are the types of Skewness? | |
| 4. How is Skewness measured? | |
| 5. How can Skewness be interpreted? | |


Previous Year Questions with Solutions
,study material
,past year papers
,Sample Paper
,Extra Questions
,Important questions
,video lectures
,Free
,Skewness: Measures | Crash Course for UGC NET Commerce
,shortcuts and tricks
,Viva Questions
,mock tests for examination
,ppt
,MCQs
,Summary
,Objective type Questions
,Exam
,Skewness: Measures | Crash Course for UGC NET Commerce
,Semester Notes
,practice quizzes
,Skewness: Measures | Crash Course for UGC NET Commerce
;


Skewness: Measures Free PDF Download
Importance of Skewness: Measures
Skewness: Measures Notes
Skewness: Measures UGC NET Questions
Study Skewness: Measures on the App
|
© EduRev
|
Education Revolution
|


|


within 7 days!