Correlation & Regression | Crash Course for UGC NET Commerce PDF Download
| Table of contents |
|
| Correlation and Regression |
|
| What are Correlation and Regression? |
|
| Correlation and Regression Analysis |
|
| Regression Analysis |
|
| Correlation and Regression Formulas |
|

Correlation and Regression
- Correlation and regression are two widely used methods for examining the relationship between quantitative variables. In this context, regression specifically refers to linear regression.
- While correlation measures the strength and direction of the relationship between variables, linear regression provides an equation that models this relationship.
- Both correlation and regression are applied to determine associations between quantitative variables that are assumed to have a linear relationship.
- This article will explore these concepts in more detail, discuss the differences between correlation and regression, and provide some practical examples.
What are Correlation and Regression?
Correlation and regression are statistical tools used to describe the relationship between two variables. For instance, if someone is driving a luxury car, it might be assumed that they are financially well-off. Correlation and regression offer ways to numerically assess and express this kind of relationship.
Correlation Explained
- Correlation measures the strength and direction of the relationship between variables.
- If an increase (or decrease) in one variable corresponds to a similar change in another, the variables are said to be positively correlated.
- Conversely, if an increase in one variable results in a decrease in the other, they are negatively correlated.
- If changes in one variable do not affect the other, the variables are considered uncorrelated.
- Therefore, correlation can be positive, negative, or zero, and this relationship is represented by the correlation coefficient.
Definition of Regression
Regression is a statistical method used to quantify how changes in one variable influence another. It helps in identifying the cause-and-effect relationship between two variables. Among various types of regression, linear regression is the most commonly used due to its simplicity in analysis. Linear regression aims to find the best-fit line that establishes the relationship between the variables.
Correlation and Regression Analysis
Both correlation and regression analyses are employed to measure the strength of the relationship between two variables numerically. These relationships can be visually represented using scatter plots.
Correlation analysis is conducted to determine whether a relationship exists between the variables under study. A correlation coefficient, such as Pearson's correlation coefficient, assigns a signed numeric value that indicates both the strength and direction of the relationship. The scatter plot shows the correlation between two variables, x and y, for individual data points as demonstrated below.
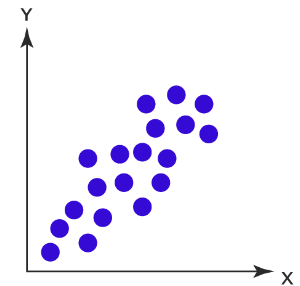 Correlation Analysis Graph
Regression Analysis
Regression analysis is used to identify the relationship between two variables, allowing the value of an unknown variable to be estimated based on the known variable(s). The objective of linear regression is to determine the best-fit line through the data points. For two variables, x and y, regression analysis can be illustrated as follows:
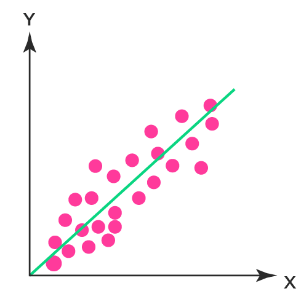 Regression Analysis Graph
Correlation and Regression Formulas
The most effective way to perform correlation and regression analysis is by using Pearson's correlation coefficient for correlation and the method of least squares for regression. The formulas for correlation and regression are given below:
Pearson's Correlation Coefficient: 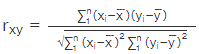
Ordinary Least Squares (OLS) Linear Regression:
The straight line equation is given as y = α + βx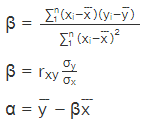
Here, represents the mean, and σx denotes the standard deviation of the first data set, where each data point is represented by xi. Similarly,
  is the mean, and σy is the standard deviation of the second data set. n represents the number of data points in the datasets.
Difference Between Correlation and Regression
Correlation and regression are statistical methods used to understand the relationship between variables. If the correlation coefficient is negative (or positive), the slope of the regression line will also be negative (or positive). The table below outlines the key differences between correlation and regression.
|
157 videos|236 docs|166 tests
|
FAQs on Correlation & Regression - Crash Course for UGC NET Commerce
| 1. What is the difference between correlation and regression analysis? |  |
| 2. How are correlation and regression formulas calculated? | |
| 3. Why is correlation and regression analysis important in research studies? | |
| 4. Can correlation be used to determine causation between variables? | |
| 5. How can correlation and regression analysis be used in business decision-making? | |


past year papers
,video lectures
,Correlation & Regression | Crash Course for UGC NET Commerce
,Semester Notes
,practice quizzes
,Objective type Questions
,Viva Questions
,Extra Questions
,Sample Paper
,study material
,mock tests for examination
,Correlation & Regression | Crash Course for UGC NET Commerce
,Previous Year Questions with Solutions
,ppt
,Exam
,MCQs
,Free
,Correlation & Regression | Crash Course for UGC NET Commerce
,shortcuts and tricks
,Important questions
,Summary
;


Correlation & Regression Free PDF Download
Importance of Correlation & Regression
Correlation & Regression Notes
Correlation & Regression UGC NET Questions
Study Correlation & Regression on the App
|
© EduRev
|
Education Revolution
|


|


within 7 days!