Probability Distributions: Binomial, Poisson & Normal Distribution | Crash Course for UGC NET Commerce PDF Download
| Table of contents |

|
| Overview |

|
| Types of Distributions |

|
| Normal Distribution |

|
| Binomial Distribution |

|
| Poisson Distribution |

|
Overview
Distribution plays a crucial role in analyzing data sets by showcasing the potential outcomes and their frequencies. Businesses utilize these distributions for forecasting events, understanding outcomes, and predicting probabilities for development and data interpretation.
Types of Distributions
- Normal Distribution
- Binomial Distribution
- Poisson Distribution
Normal Distribution

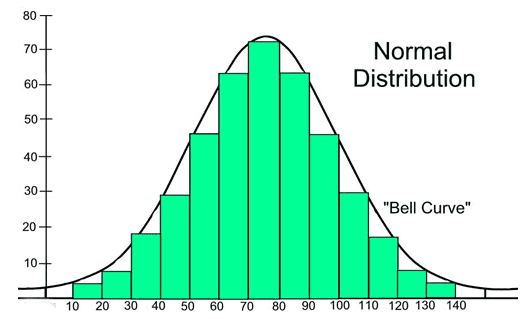
Normal distribution is essential in modern workplaces, where businesses rely on analytics rather than instincts and experience to extract value from data.
Key Characteristics of Normal Distribution:
- Occurs naturally in various scenarios.
- Data points are similar and fall within a narrow range.
- Significantly fewer outliers at the extremes of the data range.
Example:

Formula Values:
x = Value being standardized.
μ = Mean of the distribution.
σ = Standard deviation of the distribution.
- Use the following formula to convert a raw data value ‘X’ to a standard score ‘Z’.
- Assuming a specific population has = 4, and = 2. For example, finding the probability of the randomly selected value being greater than 6 would resemble the following formula:
- The Z score corresponding to X = 6 will be:

- Z = 1 means that the value of X = 6 which is 1 standard deviation above the mean.
Business Applications:
- Utilization in modeling risks and predicting likely outcomes for specific events, such as projecting next month's revenue from a particular service.
- Process variations in operations management and employee performance in Human Resource Management can sometimes follow a normal distribution.
- Human Resource management employs the Normal Distribution model to assess and understand employee performance effectively.
Binomial Distribution
Binomial Distribution is a concept that deals with the probability of achieving a pass or fail outcome in a repeated experiment or survey. It involves scenarios where there are only two possible results, such as True or False, or Heads or Tails.
Characteristics of Binomial Distribution
- First variable: The number of times an experiment is conducted
- Second variable: Probability of a single, particular outcome
- None of the performed trials have any effect on the probability of the following trial
- Likelihood of success is the same from one trial to the following trial

Formula Values:
x: Number of successes
X: Random variable
C: Combination of x successes from n trials
p: Probability of success
(n - ): Number of failures
(1 - p): Probability of failure
- Assuming that 15% of changing street lights records a car running a red light, and the data has a binomial distribution.
- The formula used to determine the probability that exactly 3 cars will run a red light in 20 light changes would be as follows: P = 0.15, n = 20, X = 3
- Apply the formula, substituting these values: P = (X-3) = 20 C3 X 0.153 * 0.8517 = 0.243
- Therefore, the probability of 3 cars running a red light in 20 light changes would be 0.24, or 24%.
Business Applications:
- Banks and other financial institutions use Binomial Distribution to determine the likelihood of borrowers defaulting. This helps in pricing insurance, figuring out reserve amounts, and deciding on loan amounts.
Poisson Distribution

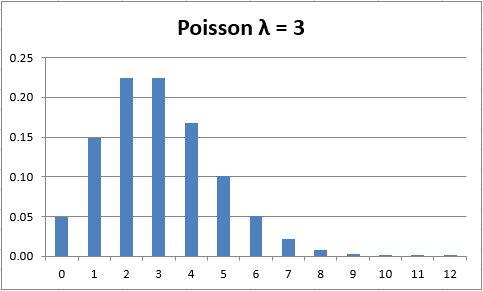
The Poisson Distribution deals with the probability of events happening at a specific time. In simpler terms, it helps us predict how often an event will occur based on how frequently it has occurred in the past. This distribution gives us the likelihood of a certain number of events taking place within a set timeframe.
Poisson Distribution Characteristics
- Events can occur any number of times during a period.
- The probability of one event happening does not influence the likelihood of another event occurring in the same period.
- The rate of occurrences remains constant and is not influenced by time.
- The probability of an event happening is related to the length of time.

Let's break down the formula:
- x: Represents the actual number of successful events.
- e: Equals 2.71828, a mathematical constant.
- Represents the average number of successes within a specified region. For example, if the average number of accidents at an intersection annually is 5, we can use this information to calculate probabilities.
For example, the average number of yearly accidents at a traffic intersection is 5. To determine the probability that there are exactly three accidents at the same intersection this year, apply the following formula:
Here, λ = 5, and x = 3
Therefore there’s a 14% chance that there will be exactly three accidents there this year.
Business Applications:
- Predicting customer sales for specific days or times of the year can help businesses anticipate demand, adjust stocking levels, and plan for staffing needs.
- Estimating supply and demand can aid in managing inventory effectively, ensuring products are available when needed.
- Industries offering services can use these predictions to prepare for busy periods, hire temporary staff, stock up on supplies, and make contingency plans to handle customer influx.
Supporting Business Objectives through Distribution Analytics
Businesses utilize data analysis to gain valuable insights for their strategies. Distribution analytics aids in enhancing their understanding of decision-making processes, assessing the potential success of choices, and predicting business outcomes. Research Optimus (ROP) experts offer a decade of experience in distribution analytics. Contact us to explore how your business can leverage our services.
|
145 videos|236 docs|166 tests
|
FAQs on Probability Distributions: Binomial, Poisson & Normal Distribution - Crash Course for UGC NET Commerce
| 1. What is the Normal Distribution? |  |
| 2. What is the Binomial Distribution? |  |
| 3. What is the Poisson Distribution? |  |
| 4. How is the Normal Distribution different from the Binomial Distribution? |  |
| 5. In what real-life scenarios can the Poisson Distribution be applied? |  |


