Important Formulas: Data Handling | Mathematics for Grade 6 PDF Download

1. A data is a collection of numbers gathered to give some information.
2. Recording Data: Recording data involves organizing information in a way that makes it easy to count and analyze.
Sometimes information is required very quickly. This is possible only when we adopt some suitable system of collecting data.
3. Organising Data: Organizing data makes it easier to understand and analyze by summarizing information clearly. The recorded data is tough to analyze unless we do not organize it properly.
Methods like tables, tally marks, and charts help efficiently manage and interpret both small and large datasets.
4. Frequency: Frequency is the number of times a particular value occurs in a given data.
Eg : Temperature of 7 days is recorded as: 25, 24, 23, 24, 24, 21, 23. 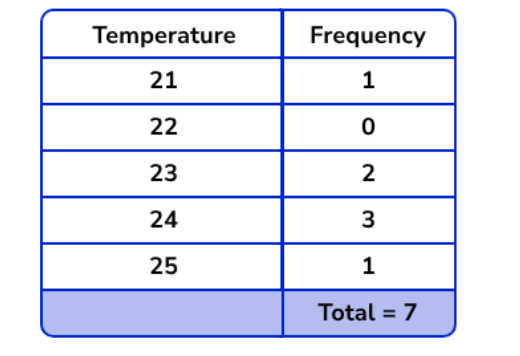
5. Tally Marks: These are used to show the frequency of the data.
6. Tally marks are used to count items, with each group of four vertical lines and a fifth mark as a diagonal cross representing five units.
For example, '||||' represents four, and ' ' represents five, so '
 ||||' shows a total of nine.
7. Frequency Distribution Table: To make a frequency distribution table, let's take an example:
- Make a table with three columns.
- Write the Temperature in the first column.
- Write the respective frequencies in front of each temperature.
- Mark the tally marks according to the frequency given.

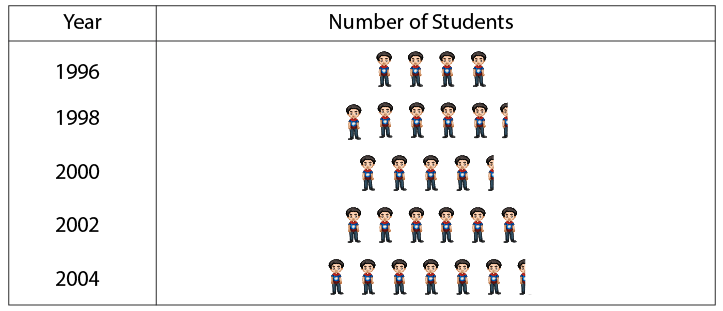
8. Pictograph: A pictograph represents data in the form of pictures, objects or parts of objects. The picture usually helps to understand the data. It helps answer the questions on the data at a glance.
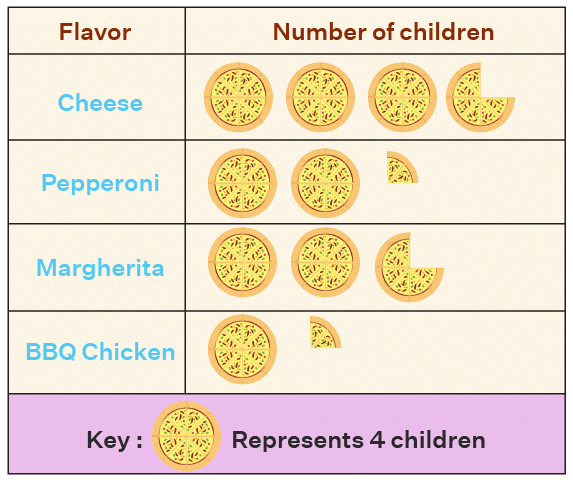
Since we cannot draw so many pictures for a larger data, we represent the key. Key means that one image represents how much frequency. So one pizza picture represents 4 number children.
10. Interpretation of a Pictograph: Simply by observing a pictograph, one can answer the related questions very quickly.
Example: Answer the questions based on this:
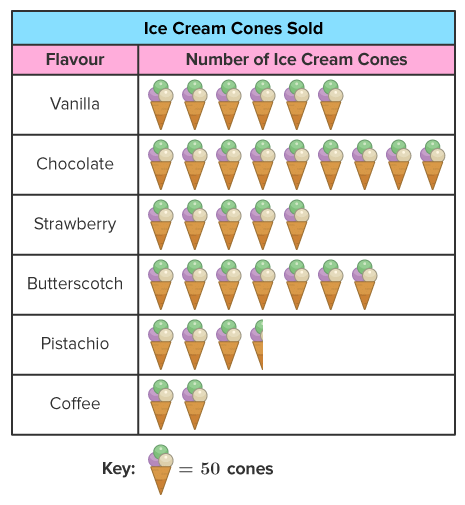
(i) How many Pistachio flavoured ice cream cones were sold?
Ans: There are 3 and a half pictures drawn. One picture represents 50 cones.
So, 3.5 x 50 = 175.
So, a total of 175 pictachio flavoured cones were sold.
(ii) How many more chocolate cones were sold than butterscotch?
Ans: Number of chocolate cones sold = 9 x 50 = 450
Number of butterscotch cones sold = 7 x 50 = 350
Number of chocolate cones that were sold more as compared to butterscotch =
450 - 350 = 100.
|
153 docs|12 tests
|
FAQs on Important Formulas: Data Handling - Mathematics for Grade 6
| 1. What are the different types of data handling in Class 6? |  |
| 2. How can data be organized in a tabular form for Class 6 students? | |
| 3. What are the common types of graphs used for representing data in Class 6? | |
| 4. How can Class 6 students interpret data from a given graph or table? | |
| 5. Why is data handling an important skill for Class 6 students to learn? | |


Important questions
,Summary
,past year papers
,Semester Notes
,Important Formulas: Data Handling | Mathematics for Grade 6
,Free
,Sample Paper
,Objective type Questions
,mock tests for examination
,Exam
,Extra Questions
,practice quizzes
,study material
,ppt
,Viva Questions
,Important Formulas: Data Handling | Mathematics for Grade 6
,MCQs
,Important Formulas: Data Handling | Mathematics for Grade 6
,shortcuts and tricks
,Previous Year Questions with Solutions
,video lectures
;


Important Formulas: Data Handling Free PDF Download
Importance of Important Formulas: Data Handling
Important Formulas: Data Handling Notes
Important Formulas: Data Handling Grade 6 Questions
Study Important Formulas: Data Handling on the App
|
© EduRev
|
Education Revolution
|


|


