Worksheet Solutions: Data Handling and Presentation - 1 | Worksheets with Solutions for Class 6 PDF Download

Multiple Choice Questions (MCQs)
Q1: What is data primarily used for?
(a) Entertainment
(b) Collecting facts and numbers
(c) Cooking
(d) None of the above
Ans: (b) Collecting facts and numbers
Q2: Which of the following is a visual representation of data?
(a) Pictograph
(b) List
(c) Paragraph
(d) All of the above
Ans: (a) Pictograph
Q3: What does a bar graph represent?
(a) Numerical values
(b) Qualitative data
(c) Textual information
(d) None of the above
Ans: (a) Numerical values
Q4: In a pictograph, each picture can represent:
(a) One item only
(b) Multiple items
(c) Only data points
(d) None of the above
Ans: (b) Multiple items
Q5: What is the key function of infographics?
(a) To confuse the reader
(b) To present data in a visually engaging way
(c) To provide lengthy explanations
(d) None of the above
Ans: (b) To present data in a visually engaging way
Fill in the Blanks
Q1: Navya collected data on her classmates' favorite fruits. She found that 8 students liked apples, 12 liked bananas, and 5 liked oranges. The total number of students she surveyed is _______.
Ans: 25
Solution: The total number is found by adding the number of students who liked each fruit: 8 + 12 + 5 = 25.
Q2: A pictograph uses 1 symbol to represent 5 students. If 4 symbols are used to show the number of students who like chocolate, then _______ students like chocolate.
Ans: 20
Solution: Multiply the number of symbols (4) by the number each symbol represents (5): 4 × 5 = 20.
Q3: In a bar graph, the bar representing the number of students absent in Class 5 is twice the height of the bar for Class 3. If Class 3 had 4 students absent, then Class 5 had _______ students absent.
Ans: 8
Solution: Since the bar for Class 5 is twice as high, multiply the number of absent students in Class 3 by 2: 4 × 2 = 8.
Q4: If each tally mark represents 1 vote and 15 tally marks are recorded for a favorite game survey, then the total number of votes is _______.
Ans: 15
Solution: Each tally mark equals one vote, so the total number of votes equals the number of tally marks.
Q5: The number of symbols in a pictograph must be multiplied by _______ to find the total if each symbol represents more than one unit.
Ans: the scale
Solution: Multiply the number of symbols by the scale to find the total number of units represented.
True or False
Q1: A bar graph can only have vertical bars.
Ans: False
Solution: Bar graphs can have either vertical or horizontal bars, depending on what is being represented.
Q2: In a pictograph, one symbol can represent multiple units.
Ans: True
Solution: A scale in a pictograph allows one symbol to represent multiple units, making it easier to manage larger data.
Q3: The height of a bar in a bar graph does not need to correspond to the frequency it represents.
Ans: False
Solution: The height of a bar in a bar graph must correspond to the frequency to accurately represent the data.
Q4: A pictograph is useful for representing large amounts of data.
Ans: False
Solution: While pictographs are visually appealing, they are not always practical for representing large datasets.
Q5: The scale in a pictograph does not need to be mentioned.
Ans: False
Solution: The scale must be mentioned in a pictograph to clearly show what each symbol represents.
Solve the following
Q1: Study the following tally marks frequency table and answer the questions given below: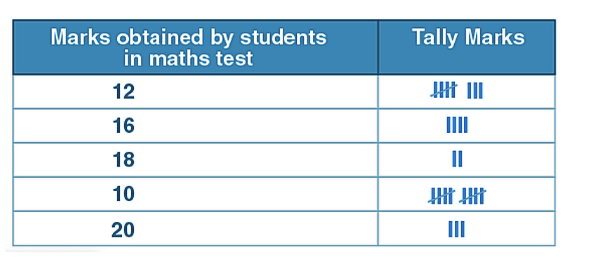
(i) How many students score 10 marks?
(ii) How many students scored above 10?
(iii) How many total students appeared on the test?
Solution:
(i) Number of students scored 10 marks = 10
(ii) Number of students scored above 10 marks = 17
(iii) Total number of students who appeared for the test = 27
Q2: Following are the scores of students of class 3 in a maths test:
12, 12, 14, 15, 16, 18, 13, 15, 16, 17, 18, 13, 16, 20, 20, 19, 17, 15, 12, 15, 16, 17, 18, 18, 19, 20, 16. 19.
Make a tally marks table.
Solution: 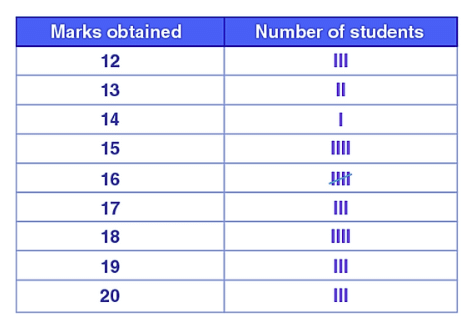
Q3: Tim recorded the number of donuts sold over five days.
Read the chart and answer the questions.
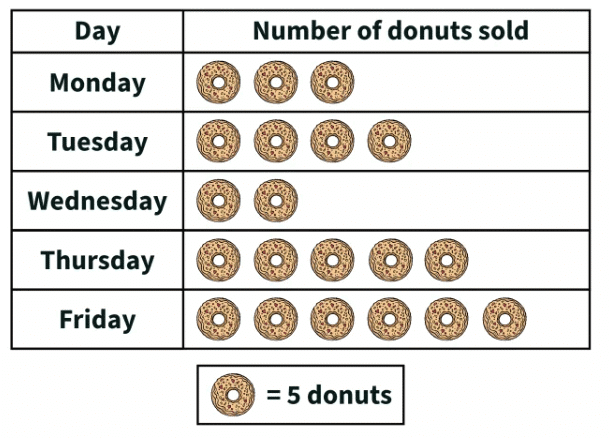
- How many donuts did he sell on Thursday?
- Which day did he sell the least donuts?
- Which day did he sell the most donuts?
- Which day did he sell 20 donuts?
Solution:
- Donuts sold on Thursday = 5 x 5 = 25 donuts
- least donuts were sold on Wednesday
- most donuts were sold on Friday
- Tuesday
FAQs on Worksheet Solutions: Data Handling and Presentation - 1 - Worksheets with Solutions for Class 6
| 1. What is data handling in Class 6? |  |
| 2. What are the different types of data presentations taught in Class 6? | |
| 3. How can students collect data for their projects in Class 6? | |
| 4. Why is it important to learn about data handling in Class 6? | |
| 5. What tools or software can be used for data presentation in Class 6? | |


shortcuts and tricks
,Viva Questions
,Worksheet Solutions: Data Handling and Presentation - 1 | Worksheets with Solutions for Class 6
,Semester Notes
,video lectures
,Summary
,Worksheet Solutions: Data Handling and Presentation - 1 | Worksheets with Solutions for Class 6
,practice quizzes
,past year papers
,Important questions
,mock tests for examination
,Previous Year Questions with Solutions
,ppt
,study material
,Sample Paper
,Exam
,Extra Questions
,Free
,Objective type Questions
,Worksheet Solutions: Data Handling and Presentation - 1 | Worksheets with Solutions for Class 6
,MCQs
;


Worksheet Solutions: Data Handling and Presentation - 1 Free PDF Download
Importance of Worksheet Solutions: Data Handling and Presentation - 1
Worksheet Solutions: Data Handling and Presentation - 1 Notes
Worksheet Solutions: Data Handling and Presentation - 1 Class 6 Questions
Study Worksheet Solutions: Data Handling and Presentation - 1 on the App
|
© EduRev
|
Education Revolution
|


|


