Biasing Techniques JFET | Analog and Digital Electronics - Electrical Engineering (EE) PDF Download
JFET biasing involves setting the correct voltage levels at the gate and drain to control the transistor’s operation. Before discussing JFET biasing, let’s understand what pinch-off voltage is, as it plays a crucial role in determining the biasing level of a JFET.
Pinch Off Voltage
In an n-channel JFET, applying a positive potential at the drain while keeping the source grounded causes current to flow from drain to source. This creates a voltage drop along the channel, with higher potential near the drain than the source. If the gate is grounded, the PN junction between the gate and channel is reverse biased, with a wider depletion layer near the drain than the source.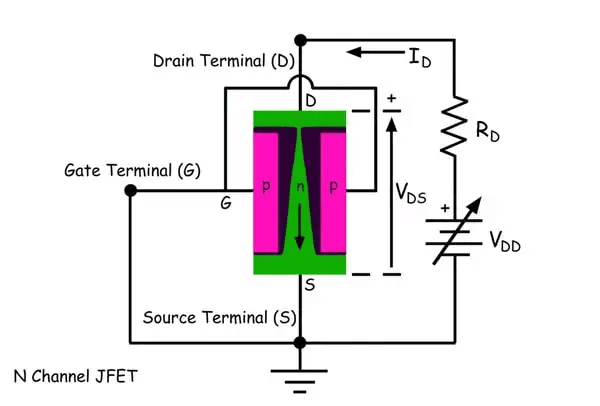 As we continuously increase the drain voltage, the depletion layer width increases more near the drain than the source. At a certain drain voltage, the depletion layers meet, known as the pinch-off voltage. At zero gate voltage, this is the drain voltage where the depletion layers touch. Before pinch-off, drain current increases linearly with drain-source voltage, becoming almost constant just after pinch-off. Further increasing the drain voltage beyond pinch-off keeps the current constant until avalanche breakdown occurs at a higher voltage, rapidly increasing the current. Therefore, a JFET must operate between pinch-off and breakdown voltages for amplification. To maintain this range, a DC voltage source or battery is connected in series with the load resistance.
The pinch-off voltage appears between drain and source is Here IDSS is the drain current flowing through the channel at pinch-off while the gate terminal is in ground potential.
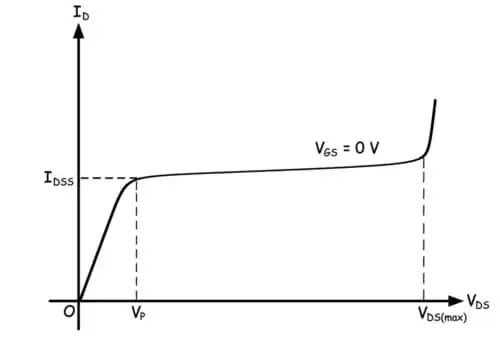 In an n-channel JFET, applying a negative potential to the gate terminal further increases the depletion layer width between the gate region and channel. This increases the reverse biasing of the junction. As discussed earlier, with the drain voltage applied and the gate grounded, the depletion layers near the drain touch, creating a small channel opening for the drain current to flow.
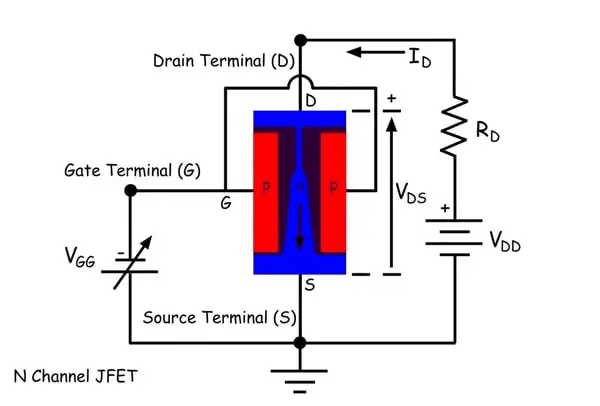 When we increase the negative potential of the gate terminal, the channel opening gets narrower and hence drain current gets reduced. If we go on increasing negative gate terminal voltage, the drain current continues decreasing, and it would be seen that the drain current becomes zero at a certain gate voltage. This voltage is known as gate cut off voltage. The value of the gate cut off voltage is equal to pinch off voltage of a junction field effect, but the polarity of these two voltages are opposite.
 So the operating range of the input signal of a JFET should be 0 to – VGS(off) where VGS(off) is the gate cut off voltage. To ensure the operating range of varying input signal the gate circuit must be associated with a fixed biased voltage which can be applied to the gate circuit either by a separate battery source or by voltage diversion from the output circuit.
The JFET Biasing Problem Statement
Consider an n-channel JFET with IDSS = 8 mA and VP = -2 V. The transfer characteristic of the JFET in the saturation region is shown in Figure 1.
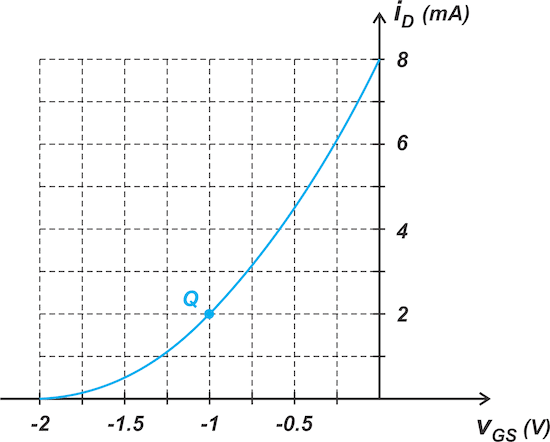
Figure 1. N-channel JFET I-V curve in saturation.
With that in mind, let's assume that the goal is to bias the JFET at point Q corresponding to iD = 2 mA and vGS = -1 V. There are a few basic biasing methods that we’ll explore below.
Biasing Method 1—the Constant Voltage Bias
The simplest biasing scheme, known as constant voltage bias, is shown in Figure 2.
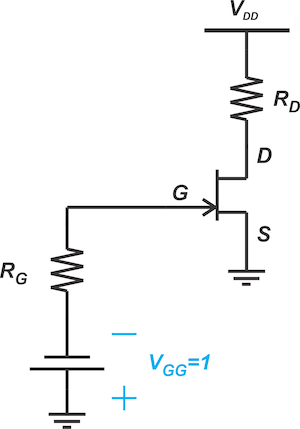
Figure 2. Constant voltage biasing circuit for an n-channel JFET.
Under normal conditions, the gate current of a JFET is essentially zero, and no voltage drops across RG. Thus, the voltage source, VGG, directly appears across the source-gate junction—i.e., vGS = -VGG. By choosing VGG = 1, we can set the bias point to vGS = -1 V. To find the drain current, we can simply substitute the following into Shockley's equation, shown in Equation 1:
- IDSS = 8 mA
- VP = -2 V
- vGS = -1 V
Which produces iD = 2 mA.
In addition, a graphical approach can be employed to determine the DC operating point of the above circuit. To do this, we find the intersection point of the line vGS = -1 with the device characteristic curve (Figure ).
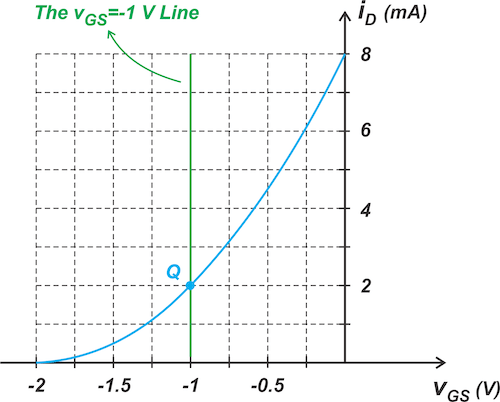
Figure . Determining the JFET current for a specific gate-source voltage.
Advantages of the Graphical Approach
The graphical approach can help us develop a more intuitive understanding of the circuit operation. As an example, consider the following circuit (Figure 4), where the input AC signal is applied through the coupling capacitor, C1.
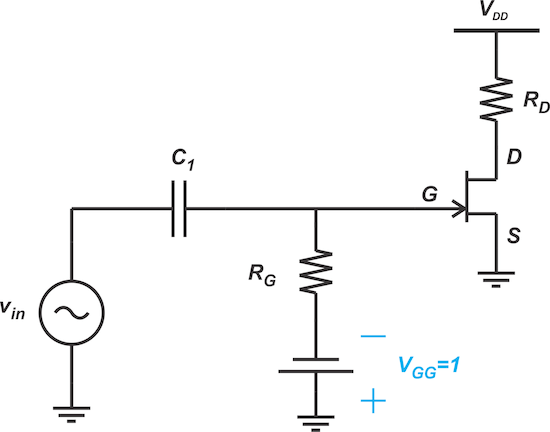
Figure 4. Driving a JFET with an AC-coupled sinusoidal signal.
Let vin be a sinusoidal input with amplitude, A, and assume that the coupling capacitor is sufficiently large so the excursions of vin appear at the gate terminal with no attenuation. In this case, the AC signal adds algebraically to DC bias voltage. Therefore, vGS varies from -1 -A to -1 +A volts. This is illustrated in Figure 5.
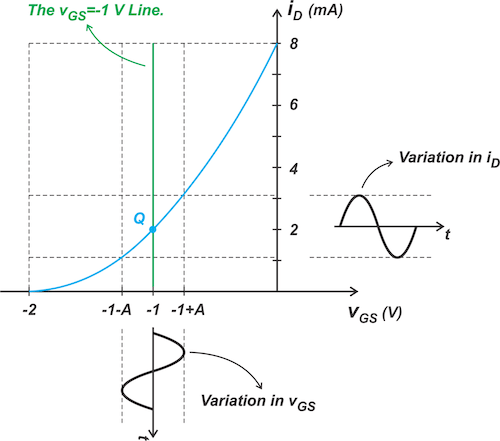
Figure 5. Effect of sinusoidal gate-source voltage variation on the JFET drain current.
By finding the intersection point of the lines corresponding to the maximum and minimum of vGS with the characteristic curve, we can determine the variation in the drain current. In the above example, iD varies from just above 1 mA to slightly higher than 3 mA.
Another advantage of the graphical method is that it helps you visualize how distortion can increase at certain points of the curve. Recall that the slope of the characteristic curve specifies the transconductance of the circuit, which is related to the circuit’s gain. Therefore, a larger curvature in the iD - vGS plot corresponds to a larger distortion. To clarify this, consider the example depicted in Figure 5. Assume that the DC operating point of the circuit is changed to Q1, as depicted below in Figure 6.
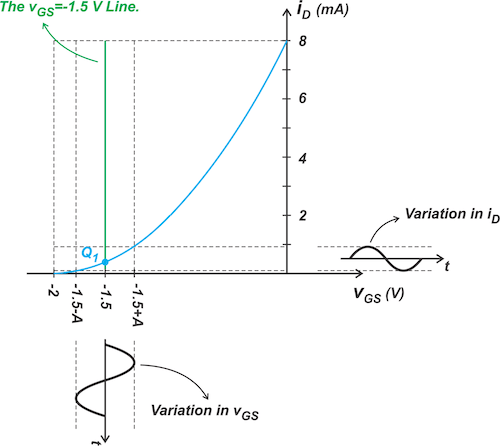
Figure 6. Demonstration of reduced JFET gain as the bias voltage is reduced.
The slope of the curve approaches zero as we get closer and closer to the pinch-off voltage. Therefore, in the above example, the transconductance changes from almost zero to a positive value. Thus, we expect the above circuit to have a larger distortion. Also, note that with the new bias point, the variation in iD is much smaller than in the previous case. This means that the new bias point provides a smaller gain.
Biasing Method 2—the Self-bias Configuration
To avoid the need for two DC supplies, the self-bias configuration shown in Figure can be used.
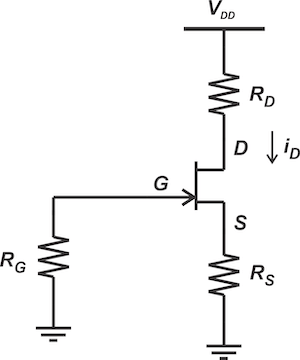
Figure . JFET self-biasing circuit schematic.
In this case, the gate is held at zero volts by means of RG; however, the source is at a positive potential because the drain current flows through RS. As a result, a negative vGS is produced without employing a negative voltage supply. Applying Kirchhoff’s voltage law to the input circuit, we get Equation 2.
In the case of our example, the bias point is given—iD = 2 mA and vGS = -1 V. Substituting these values into the above equation, we obtain RS = 0.5 kΩ. Usually, RS is given, and we need to find the DC operating point. In this case, Equations 2 and 1 should be solved simultaneously to determine the JFET’s DC operating point. Alternatively, we can use the graphical approach and find the intersection point of the bias line (Equation 2) with JFET's characteristic curve. The graphical solution for RS = 0.5 kΩ is shown in Figure 8.
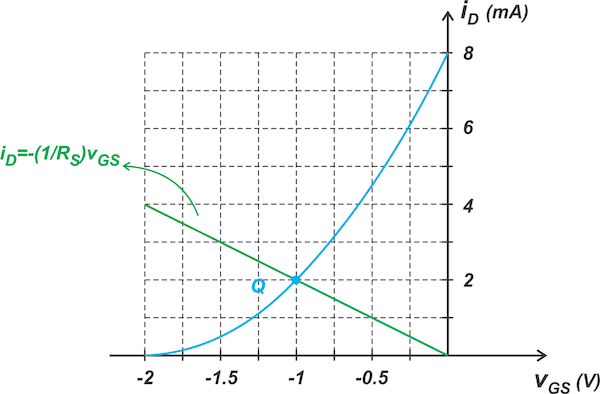
Figure . Determining the biasing point for the JFET self-biasing circuit.
Note that the slope of the line is -1/RS. Also, observe that the value of RS is fixed for a given DC operating point. Now consider applying an AC signal to the self-bias configuration (Figure ).
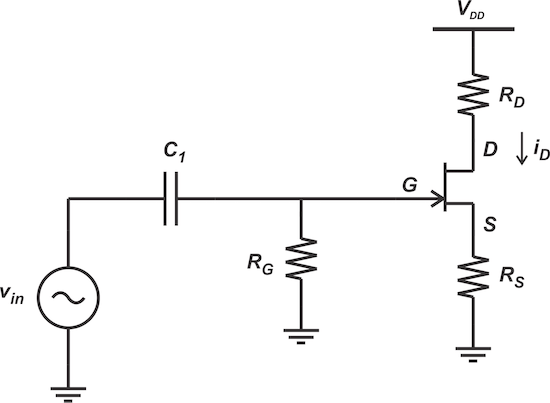
Figure . AC coupling a signal to the JFET self-biasing circuit.
Again, assume that the sinusoidal input with amplitude, A, is applied to the input, and the whole signal excursions appear at the gate terminal with no attenuation. Let’s see how the graphical method can be used to find the amplitude of variations in vGS and iD. When the input is at its maximum, the gate voltage is raised from 0 to A volts. Therefore, the bias line is modified to:
In the iD - vGS plane, the above equation corresponds to a line with a slope of -1/RS that intercepts the horizontal axis at vGS = A (the orange line in Figure).
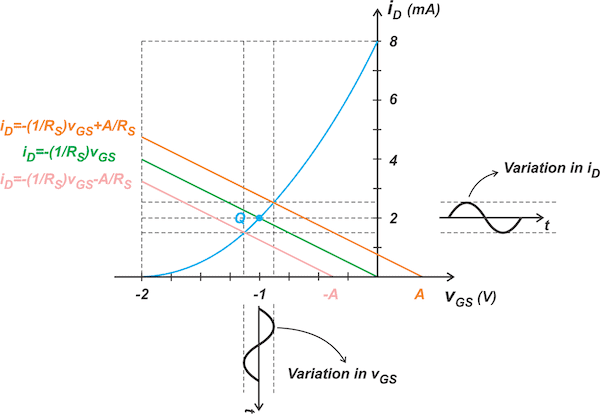
Figure . JFET drain current variation as a function of the gate-source voltage variation.
Similarly, when the AC input is at its minimum, the bias line is a line with a slope of -1/RS that intercepts the horizontal axis at vGS = -A (the pink line in the above figure). The intersection points of these lines with the characteristic curve specify the variation in vGS and iD.
|
137 videos|143 docs|71 tests
|

|
Explore Courses for Electrical Engineering (EE) exam
|

|


