Unit Test (Solutions): Statistics | Mathematics (Maths) Class 10 PDF Download
Time: 1 hour
M.M. 30
Attempt all questions.
- Question numbers 1 to 5 carry 1 mark each.
- Question numbers 6 to 8 carry 2 marks each.
- Question numbers 9 to 11 carry 3 marks each.
- Question number 12 & 13 carry 5 marks each.
Q1: If the mean of first n natural numbers is 3n/5, then the value of n is: (1 Mark)
(a) 3
(b) 4
(c) 5
(d) 6
Ans: (c)
Sum of natural numbers = n(n + 1)/2
Given, mean = 3n/5
Mean = sum of natural numbers/n
3n/5 = n(n + 1)/2n
3n/5 = (n + 1)/2
6n = 5n + 5
n = 5
Q2: The class interval of a given observation is 10 to 15, then the class mark for this interval will be: (1 Mark)
(a) 11.5
(b) 12.5
(c) 12
(d) 14
Ans: (b)
Class mark = (Upper limit + Lower limit)/2
= (15 + 10)/2
= 25/2
= 12.5
Q3: If the sum of frequencies is 24, then the value of x in the observation: x, 5,6,1,2, will be: (1 Mark)
(a) 4
(b) 6
(c) 8
(d) 10
Ans: (d)
Given,
∑fi = 24
∑fi = x + 5 + 6 + 1 + 2 = 14 + x
24 = 14 + x
x = 24 – 14 = 10
Q4: Find the class marks of classes 10-25 and 35-55. (1 Mark)
(a) 17.5, 20
(b) 18. 40
(c) 17.5, 45
(d) 17.5, 45
Ans: (d)
Class mark of 10-25 = 
Class mark of 35-55 
Q5: The method used to find the mean of a given data is(are): (1 Mark)
(a) direct method
(b) assumed mean method
(c) step deviation method
(d) all the above
Ans: (d)
The mean for a given data can be calculated using either of the following methods:
i) Direct method
ii) Assumed mean method
iii) Step deviation method
Q6: If the mode of the following data is 7, then find the value of k. (2 Marks)
2, 4, 6, 7, 5, 6, 10, 6, 7, 2k + 1, 9, 7, 13
Ans: There are two entries which occur 3 times each which are 6 and 7.
For 7 to be mode
2k + 1 = 7
k = 6/2 = 3
Q7: The mean of 6 numbers is 16 with the removal of a number the mean of remaining numbers is 17. Find the removed number. (2 Marks)
Ans: Let xd be the sixth number to be remove and x1 x2, …,x5 be remaining 5 numbers. 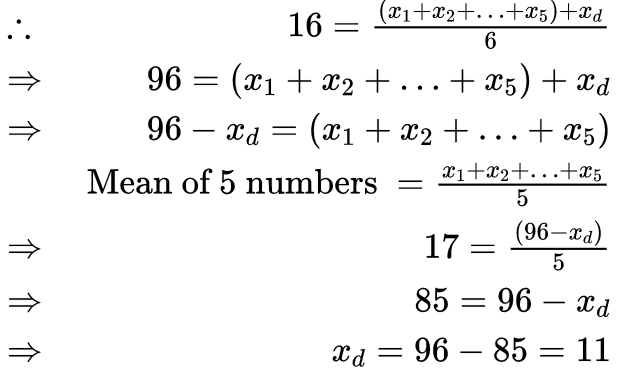
Q8: The mean of following frequency distribution is 70. Find the missing frequency x. (2 Marks)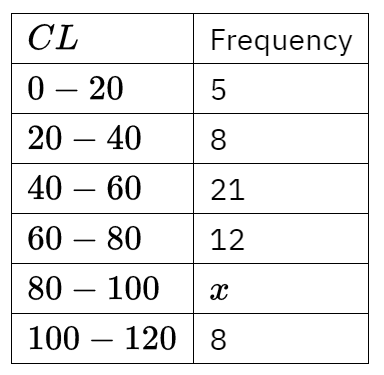
Ans: 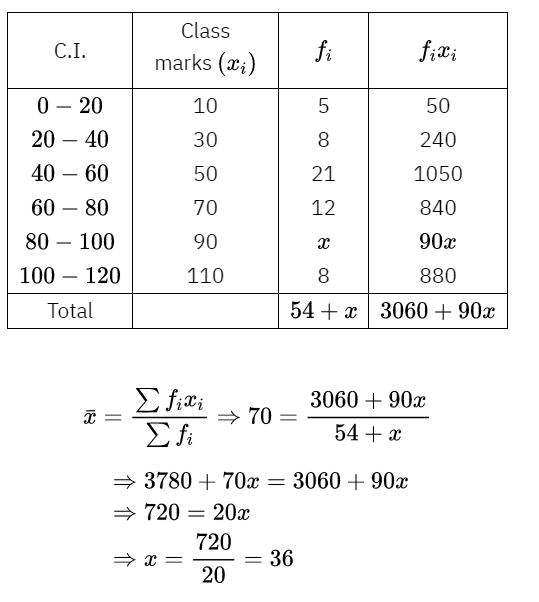
Q9: Find the mode of the following distribution of marks obtained by the students in an examination: Given the mean of the above distribution is 53, using emperical relationship estimate the value of its median. (3 Marks)
Ans: Modal class is 60-80 (Class corresponding to maximum frequency) So, the mode marks is 68.
Empirical relationship between the three measures of central tendencies is:
3 Median = Mode + 2 mean
3 Median = 68 + 2 × 53
Median = 58 marks
Q10: Find the missing frequecny (x) of the following data if its mode is ₹240. (3 Marks)
Ans: Here mode is given to be ₹ 240, which lies between 200 and 300. Therefore, modal class is 200 – 300
We have l = 200, f1 = 270, f0 = 230, f2 = x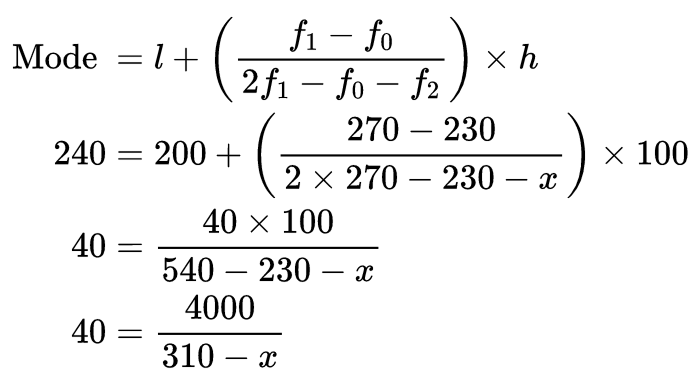 12400 – 40x = 4000
40x = 12400 – 4000
40x = 8400
x = 210
Q11: Consider the following distribution of daily wages of 50 workers of a factory. (3 Marks) Find the mean daily wages of the workers of the factory by using an appropriate method.
Ans: Find the midpoint of the given interval using the formula.
Midpoint (xi) = (upper limit + lower limit)/2
In this case, the value of mid-point (xi) is very large, so let us assume the mean value, a = 550.
Class interval (h) = 20
So, ui = (xi – a)/h
ui = (xi – 550)/20
Substitute and find the values as follows: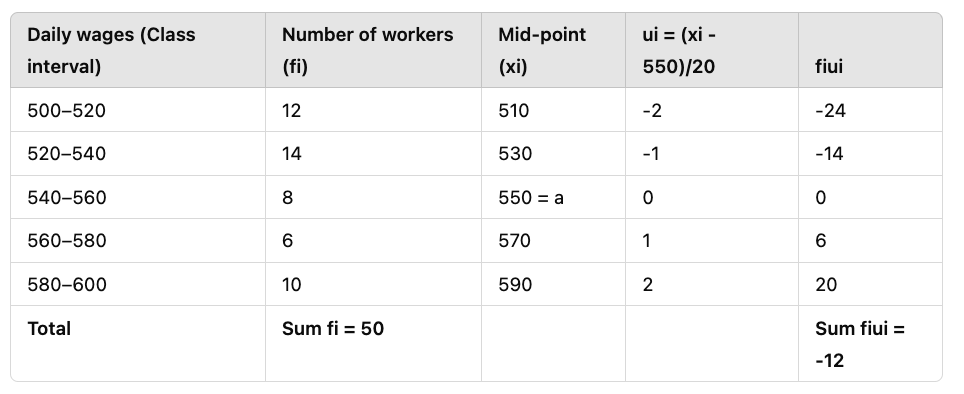 So, the formula to find out the mean is:
 Thus, mean daily wage of the workers = Rs. 545.20
Q12: The mean of the following frequency distribution is 62.8 and the sum of all frequencies is 50. Compute the missing frequencies f1 and f2. (3 Marks)
Ans: 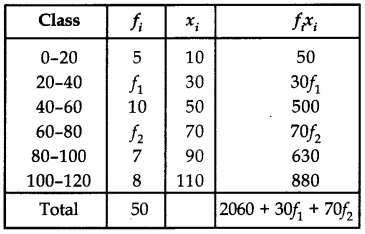
Now 50 = 5 + f1 + 10 + f2 + 7 + 8
⇒ 50 = 30 + f1 + f2
⇒ f1 + f2 = 20 ……….(i)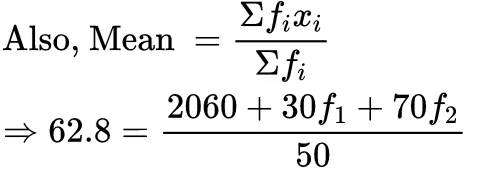
3140 = 2060 + 30f1 + 70f2
3f1 + 7f2 = 108
Solving (i) and (ii), we get
f1 = 8 and f2 = 12
Q13: Find the mean, mode and median of the following data: 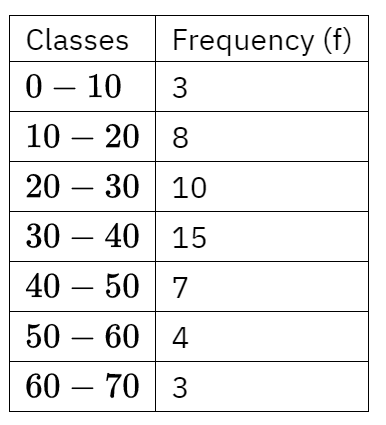
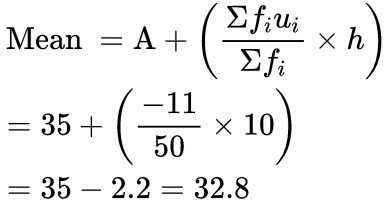
Ans: We prepare the table which serves all three purposes of getting mean, median and mode as given below: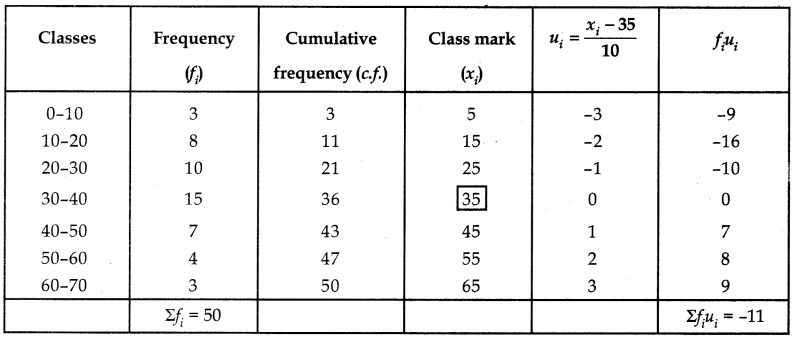 (i) Mean: Let assumed mean (A) be 35.
(ii) Mode: As maximum frequency is 15.
∴ Mode classes is 30-40.
Thus f1 = 15, f0 = 10, f2 = 7 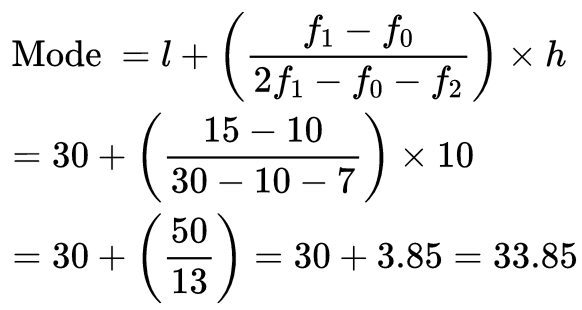
(iii) Median: Here N = 50 ⇒ N/2 = 25
The cumulative frequency just greater than 25 is 36 and the corresponding class is 30-40.
∴ Median class = 30-40, l = 30, cf = 21, f = 15 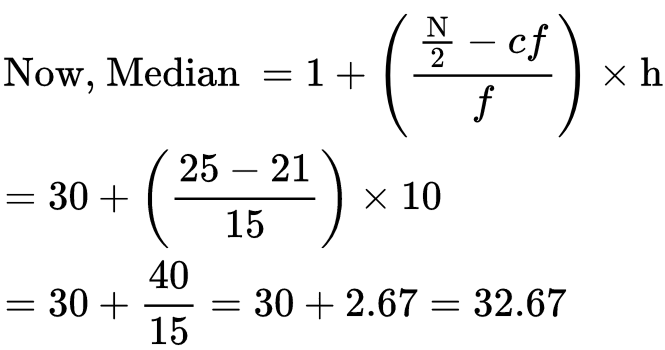
|
127 videos|584 docs|79 tests
|
FAQs on Unit Test (Solutions): Statistics - Mathematics (Maths) Class 10
| 1. What are some popular statistics hobbies that can improve my analytical skills? |  |
| 2. How can I start learning statistics as a hobby without a formal background? |  |
| 3. What tools or software should I use for my statistics hobby? |  |
| 4. Can engaging in statistics hobbies lead to career opportunities? |  |
| 5. How can I find communities or groups that share my interest in statistics? |  |


