Unit Test: Statistics | Mathematics (Maths) Class 10 PDF Download
Time: 1 hour
M.M. 30
Attempt all questions.
- Question numbers 1 to 5 carry 1 mark each.
- Question numbers 6 to 8 carry 2 marks each.
- Question numbers 9 to 11 carry 3 marks each.
- Question number 12 & 13 carry 5 marks each.
Q1: If the mean of first n natural numbers is 3n/5, then the value of n is: (1 Mark)
(a) 3
(b) 4
(c) 5
(d) 6
Q2: The class interval of a given observation is 10 to 15, then the class mark for this interval will be: (1 Mark)
(a) 11.5
(b) 12.5
(c) 12
(d) 14
Q3: If the sum of frequencies is 24, then the value of x in the observation: x, 5,6,1,2, will be: (1 Mark)
(a) 4
(b) 6
(c) 8
(d) 10
Q4: Find the class marks of classes 10-25 and 35-55. (1 Mark)
(a) 17.5, 20
(b) 18. 40
(c) 17.5, 42
(d) 17.5, 45
Q5: The method used to find the mean of a given data is(are): (1 Mark)
(a) Direct Method
(b) Assumed Mean Method
(c) Step Deviation Method
(d) All of the above
Q6: If the mode of the following data is 7, then find the value of k. (2 Marks)
2, 4, 6, 7, 5, 6, 10, 6, 7, 2k + 1, 9, 7, 13
Q7: The mean of 6 numbers is 16 with the removal of a number the mean of remaining numbers is 17. Find the removed number. (2 Marks)
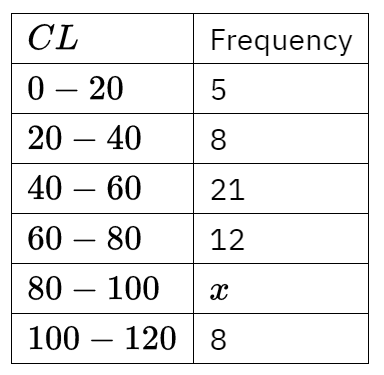
Q8: The mean of the following frequency distribution is 70. Find the missing frequency x. (2 Marks)
Q9: Find the mode of the following distribution of marks obtained by the students in an examination: Given the mean of the above distribution is 53, using emperical relationship estimate the value of its median. (3 Marks)
Q10: Find the missing frequency (x) of the following data if its mode is ₹240. (3 Marks)
Q11: Consider the following distribution of daily wages of 50 workers of a factory. (3 Marks) Find the mean daily wages of the workers of the factory by using an appropriate method.
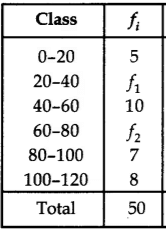
Q12: The mean of the following frequency distribution is 62.8 and the sum of all frequencies is 50. Compute the missing frequencies f1 and f2. (3 Marks)

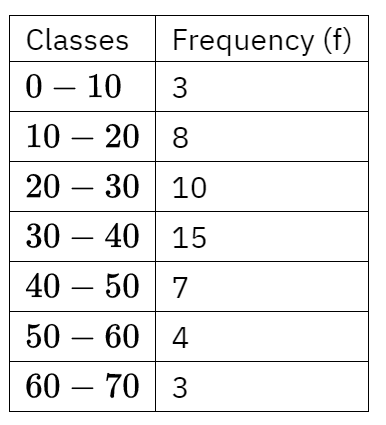
Q13: Find the mean, mode and median of the following data: 
You can find the solutions of this Unit Test here: Unit Test (Solutions): Statistics
|
127 videos|584 docs|79 tests
|
FAQs on Unit Test: Statistics - Mathematics (Maths) Class 10
| 1. What are the basic concepts of statistics that every student should know? |  |
| 2. How can I improve my statistical problem-solving skills? |  |
| 3. What are common statistical methods used in data analysis? |  |
| 4. How is statistical significance determined in hypothesis testing? |  |
| 5. What role does sampling play in statistics? |  |


