Class 10 Exam > Class 10 Notes > Mathematics Class 10 ICSE > Revision Notes: Measures of Central Tendency - Mean, Median and Mode
Revision Notes: Measures of Central Tendency - Mean, Median and Mode | Mathematics Class 10 ICSE PDF Download

The numerical expressions which represent the characteristics of a group are called Measures of Central Tendency.
Three measures of central tendency are:
i. Mean
ii. Median
iii. Mode
Arithmetic Mean
The arithmetic mean is the sum of all observations in the data divided by the number of observations.’
Arithmetic Mean of n numbers x1, x2, x3, ... , xn =
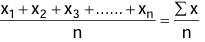
The Greek letter ∑ (called sigma) represents the sum of numbers.
The arithmetic mean may be computed by any of the following methods:
i. Direct method
ii. Short-cut method
iii. Step-deviation method
Direct method
If a variable X takes values x1, x2, x3 .... , xn with corresponding frequencies f1, f2, f3 ,... fn respectively, then the arithmetic mean of these values is given by,
Mean =

Short-cut method
This method is used to overcome the difficulty faced in calculations where large quantities are involved.
Let x1, x2 ,......., xn be values at a variable x with corresponding frequencies f1, f2,.......,fn respectively.
Takingthe derivative at an arbitrary point ‘A’, we have
Mean = A +
 where A = Assumed mean and d = x – A
Step-deviation method
Sometimes, during the application of the shortcut method for finding the arithmetic mean of the derivative d is divisible by a common number i (say).
In such cases, arithmetic is reduced to a great extent by taking ui = t =
 then
thenMean = A +

Median
- Median is the value of the middle observation(s).
- The median is to be calculated only after arranging the data in ascending order or descending order.
To find the Median for raw and arrayed data
To find the median of raw data, arrange the raw data in ascending or descending order. Then, observe the number of variables in the data. Let it be n. Then find the median as follows.
(a) If n is odd, then the
 variate is the median.
(b) If n is even, then the mean of the nth/2 and
 variates is the median, i.e.,
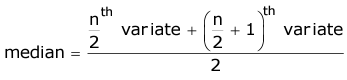
Median for tabulated data
- Construct a cumulative frequency distribution table
- If there are n terms in the given distribution, then use the table to find the value of (n/2)th or
 term, which is the median of the given distribution.
Median for grouped data (both continuous and discontinuous)
- Draw a cumulative frequency curve (Ogive).
- If there are n terms in the given distribution, then use the ogive to find the value of (n/2)th or term, which is the median of the given distribution.
Mode
- The mode of a statistical dataset is the value of that variate which has the maximum frequency.
- The mode for ungrouped data is the value that occurs most often.
- The mode may be greater than, less than or even equal to the mean.
Mode for tabulated data
- In the case of a grouped frequency distribution, a class with the maximum frequency is called as the modal class.
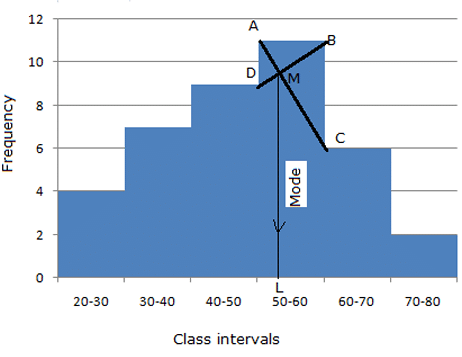
To find the mode of a group frequency distribution (using a histogram)
Steps:
- Draw a histogram of the given distribution.
- Inside the highest rectangle, which represents the maximum frequency (or modal class), draw two lines AC and BD diagonally from the upper corners C and D of adjacent rectangles.
- The point of intersection is M. Now ML is perpendicular to the horizontal axis.
- The value of point L on the horizontal axis represents the value of the mode.
Quartiles
- The three variates which divide the data of a distribution in four equal (quarters) are called quartiles.
- If there are n terms arranged in an ascending order, then
Lower Quartile (Q1) = (n/4)th term, if n is even or term, if n is odd.
 - If there are n terms arranged in an ascending order, then
Upper Quartile (Q3) = (3n/4)th term, if n is even or term, if n is odd.
 - Q2 is called the middle quartile, and the median is the second quartile.
- Lower Quartile is the value which cuts off the lowest 25% of the data. It is denoted by Q1.
- Upper Quartile is that value which cuts off the highest 25% of the data. It is denoted by Q3 and is the 75th percentile.
- The difference between the greatest variate and the smallest variate in a distribution is called the range of the distribution.
- The difference between the lower quartile and the upper quartile is the Interquartile Range, and it is equal to Q3 - Q1.
- The interquartile range is always positive, as Q3 > Q1
- Semi-interquartile range is equal to 1/2(Q3 - Q1).
The document Revision Notes: Measures of Central Tendency - Mean, Median and Mode | Mathematics Class 10 ICSE is a part of the Class 10 Course Mathematics Class 10 ICSE.
All you need of Class 10 at this link: Class 10
|
74 videos|328 docs|30 tests
|
FAQs on Revision Notes: Measures of Central Tendency - Mean, Median and Mode - Mathematics Class 10 ICSE
| 1. What is the mean in statistics and how is it calculated? |  |
Ans. The mean, often referred to as the average, is a measure of central tendency that summarizes a set of values. It is calculated by adding all the numbers in a data set and then dividing the sum by the total number of values. For example, for the data set {2, 4, 6, 8}, the mean would be (2 + 4 + 6 + 8) / 4 = 5.
| 2. What are the advantages and disadvantages of using the mean as a measure of central tendency? | |
Ans. The advantages of using the mean include its simplicity and the fact that it uses all values in the data set, providing a comprehensive overview. However, its disadvantages include sensitivity to extreme values (outliers), which can skew results. For example, in the data set {1, 2, 3, 100}, the mean is heavily influenced by the outlier 100.
| 3. How does the mean differ from other measures of central tendency, such as median and mode? | |
Ans. The mean is the average of all values, the median is the middle value when data is ordered, and the mode is the most frequently occurring value in a data set. For instance, in the set {1, 2, 2, 3, 4}, the mean is 2.4, the median is 2, and the mode is 2. Each measure provides different insights depending on the distribution of the data.
| 4. When should the mean be used instead of the median or mode? | |
Ans. The mean should be used when the data is symmetrically distributed without outliers, as it provides a more accurate representation of the data set. In contrast, the median is preferred in skewed distributions or when outliers are present, as it is less affected by extreme values. The mode is useful when identifying the most common item in categorical data.
| 5. Can the mean be used for all types of data, or are there restrictions? | |
Ans. The mean can be calculated for interval and ratio data, but it is not suitable for nominal or ordinal data. For example, calculating the mean of categories like colors or ranks does not provide meaningful information. Therefore, it is important to choose the appropriate measure of central tendency based on the type of data being analyzed.
About this Document

Oct 24, 2025
Last updated
Document Description: Revision Notes: Measures of Central Tendency - Mean, Median and Mode for Class 10 2025 is part of Mathematics Class 10 ICSE preparation.
The notes and questions for Revision Notes: Measures of Central Tendency - Mean, Median and Mode have been prepared according to the Class 10 exam syllabus. Information about Revision Notes: Measures of Central Tendency - Mean, Median and Mode covers topics
like Median, Mode and Revision Notes: Measures of Central Tendency - Mean, Median and Mode Example, for Class 10 2025 Exam. Find important definitions, questions, notes, meanings, examples, exercises and tests below for Revision Notes: Measures of Central Tendency - Mean, Median and Mode.
Introduction of Revision Notes: Measures of Central Tendency - Mean, Median and Mode in English is available as part of our Mathematics Class 10 ICSE
for Class 10 & Revision Notes: Measures of Central Tendency - Mean, Median and Mode in Hindi for Mathematics Class 10 ICSE course.
Download more important topics related with notes, lectures and mock test series for Class 10
Exam by signing up for free. Class 10: Revision Notes: Measures of Central Tendency - Mean, Median and Mode | Mathematics Class 10 ICSE
Description
Full syllabus notes, lecture & questions for Revision Notes: Measures of Central Tendency - Mean, Median and Mode | Mathematics Class 10 ICSE - Class 10 | Plus excerises question with solution to help you revise complete syllabus for Mathematics Class 10 ICSE | Best notes, free PDF download
Information about Revision Notes: Measures of Central Tendency - Mean, Median and Mode
In this doc you can find the meaning of Revision Notes: Measures of Central Tendency - Mean, Median and Mode defined & explained in the simplest way possible. Besides explaining types of
Revision Notes: Measures of Central Tendency - Mean, Median and Mode theory, EduRev gives you an ample number of questions to practice Revision Notes: Measures of Central Tendency - Mean, Median and Mode tests, examples and also practice Class 10
tests

Related Searches
Sample Paper
,Important questions
,Free
,shortcuts and tricks
,Median and Mode | Mathematics Class 10 ICSE
,Summary
,video lectures
,past year papers
,Median and Mode | Mathematics Class 10 ICSE
,Revision Notes: Measures of Central Tendency - Mean
,MCQs
,Exam
,Previous Year Questions with Solutions
,Revision Notes: Measures of Central Tendency - Mean
,Revision Notes: Measures of Central Tendency - Mean
,Extra Questions
,Semester Notes
,mock tests for examination
,Median and Mode | Mathematics Class 10 ICSE
,practice quizzes
,Objective type Questions
,study material
,Viva Questions
,ppt
;


Additional Information about Revision Notes: Measures of Central Tendency - Mean, Median and Mode for Class 10 Preparation
Revision Notes: Measures of Central Tendency - Mean, Median and Mode Free PDF Download
The Revision Notes: Measures of Central Tendency - Mean, Median and Mode is an invaluable resource that delves deep into the core of the Class 10 exam.
These study notes are curated by experts and cover all the essential topics and concepts, making your preparation more efficient and effective.
With the help of these notes, you can grasp complex subjects quickly, revise important points easily,
and reinforce your understanding of key concepts. The study notes are presented in a concise and easy-to-understand manner,
allowing you to optimize your learning process. Whether you're looking for best-recommended books, sample papers, study material,
or toppers' notes, this PDF has got you covered. Download the Revision Notes: Measures of Central Tendency - Mean, Median and Mode now and kickstart your journey towards success in the Class 10 exam.
Importance of Revision Notes: Measures of Central Tendency - Mean, Median and Mode
The importance of Revision Notes: Measures of Central Tendency - Mean, Median and Mode cannot be overstated, especially for Class 10 aspirants.
This document holds the key to success in the Class 10 exam.
It offers a detailed understanding of the concept, providing invaluable insights into the topic.
By knowing the concepts well in advance, students can plan their preparation effectively.
Utilize this indispensable guide for a well-rounded preparation and achieve your desired results.
Revision Notes: Measures of Central Tendency - Mean, Median and Mode
Revision Notes: Measures of Central Tendency - Mean, Median and Mode Notes offer in-depth insights into the specific topic to help you master it with ease.
This comprehensive document covers all aspects related to Revision Notes: Measures of Central Tendency - Mean, Median and Mode.
It includes detailed information about the exam syllabus, recommended books, and study materials for a well-rounded preparation.
Practice papers and question papers enable you to assess your progress effectively.
Additionally, the paper analysis provides valuable tips for tackling the exam strategically.
Access to Toppers' notes gives you an edge in understanding complex concepts.
Whether you're a beginner or aiming for advanced proficiency, Revision Notes: Measures of Central Tendency - Mean, Median and Mode Notes on EduRev are your ultimate resource for success.
Revision Notes: Measures of Central Tendency - Mean, Median and Mode Class 10 Questions
The "Revision Notes: Measures of Central Tendency - Mean, Median and Mode Class 10 Questions" guide is a valuable resource for all aspiring students preparing for the
Class 10 exam. It focuses on providing a wide range of practice questions to help students gauge
their understanding of the exam topics. These questions cover the entire syllabus, ensuring comprehensive preparation.
The guide includes previous years' question papers for students to familiarize themselves with the exam's format and difficulty level.
Additionally, it offers subject-specific question banks, allowing students to focus on weak areas and improve their performance.
Study Revision Notes: Measures of Central Tendency - Mean, Median and Mode on the App
Students of Class 10 can study Revision Notes: Measures of Central Tendency - Mean, Median and Mode alongwith tests & analysis from the EduRev app,
which will help them while preparing for their exam. Apart from the Revision Notes: Measures of Central Tendency - Mean, Median and Mode,
students can also utilize the EduRev App for other study materials such as previous year question papers, syllabus, important questions, etc.
The EduRev App will make your learning easier as you can access it from anywhere you want.
The content of Revision Notes: Measures of Central Tendency - Mean, Median and Mode is prepared as per the latest Class 10 syllabus.
|
© EduRev
|
Education Revolution
|


|


Signup on EduRev and stay on top of your study goals
10M+ students crushing their study goals daily