Worksheet Solutions: Data Handling and Presentation -2

Q1: The pictograph shows how many snowballs each child made. Use the pictograph to answer the given questions.
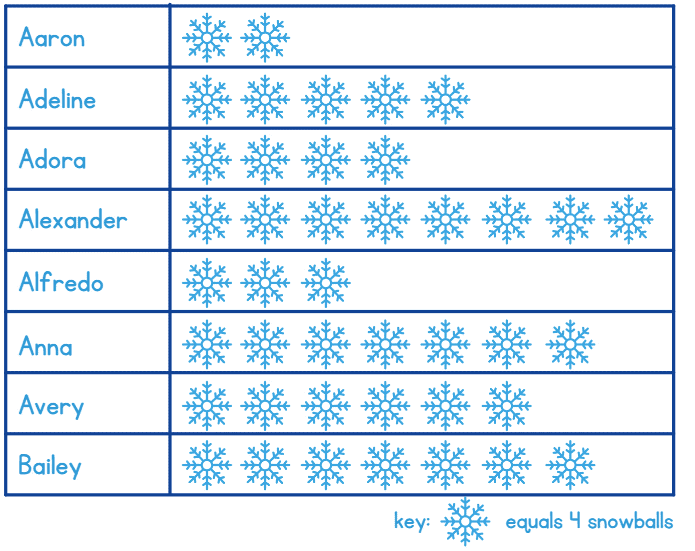
(i) How many snowballs did Alfredo make?
Ans: There are 3 pictures in front of Alfredo. 1 snowflake represents 4 snowballs made.
So, Alfredo made 3x4 = 12 snowballs.
(ii) How many snowballs did Aaron make?
Ans: There are 2 pictures in front of Aaron. 1 snowflake represents 4 snowballs made.
So, Aaron made 2x4 = 8 snowballs.
(iii) Name two people who made the same number of snowballs.
Ans: Anna and Bailey made the same number of snowballs.
We can simply look at the number of snowflakes in front of each name and see that Anna and Bailey have same number of snowflakes drawn in front of their names.
There are 7 snowflakes which means 7x4 = 28. So, Anna and Bailey, both of them, made 28 snowballs each.
(iv) How many more snowballs did Bailey make than Adeline?
Ans: Bailey made 28 snowballs where as Adeline made 20 snowballs (5x4 = 20)
28- 20 = 8
Bailey made 8 more snowballs than Adeline.
(v) How many more snowballs did Alexander make than Adora?
Ans: Alexander : 8 x 4 = 32 snowballs
Adora: 4 x 4 = 16
32- 16 = 16
Alexander made 16 more snowballs than Adora.
Q2: Following are the marks obtained by 72 students in Geography. Arrange these marks in a table using tally marks.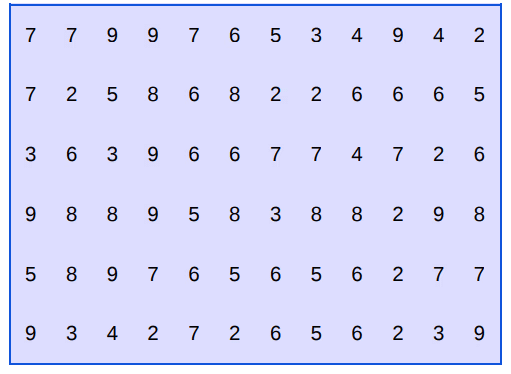
(a) students obtained more than 6 marks.
(b) students obtained marks equal to or below 2.
Ans:
Step 1: To count the marks obtained by the students, look at the following tally table:
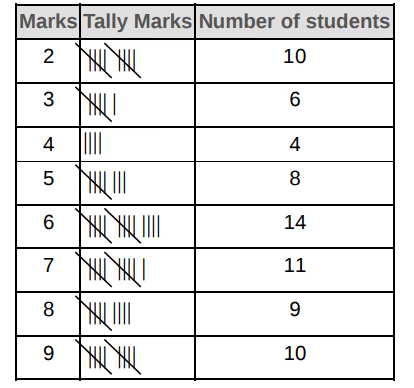
Step 2: Number of students who scored more than 6 marks Or, the number of students who scored marks 7, 8, 9 = 11 + 9 + 10 = 30 students
Step 3: Number of students who scored marks equal or less than 2 Or, the number of students who scored marks 2 = 10 = 10 students
Q3: Reena collected the data for the ages (in years) of her hobby class group and she recorded the findings in the manner shown below :
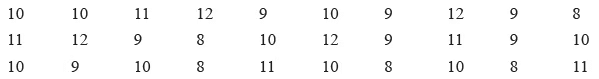
Represent the above data using tally marks in the table below :
| Ages (in years) | Tally Marks | Frequency |
| 8 |  | 05 |
| 9 | ||
| 10 | ||
| 11 | ||
| 12 |
(i) Find the age that appeared maximum number of times?
(ii) Find the ages that appeared equal number of times.
(iii) How many children are below 11 years?
(iv) How many children are of 10 years or above?
Ans:
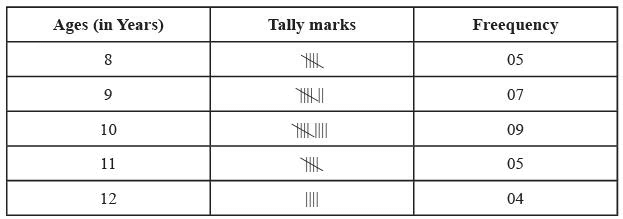
(i) The age that appeared maximum number of times is 10 years.
(ii) 8 years & 11 years of age appeared equal number of times i.e. 5 times.
(iii) The total number of children below 11 years are 5 + 7 + 9 = 21
(iv) The total number of children that are of 10 years and above are 9 + 5 + 4 = 18
Q4: Following is the pictograph of class VI students. Here 1  = 10 boys and 1
  = 10 girls. Looking at the pictograph below, answer the following questions.
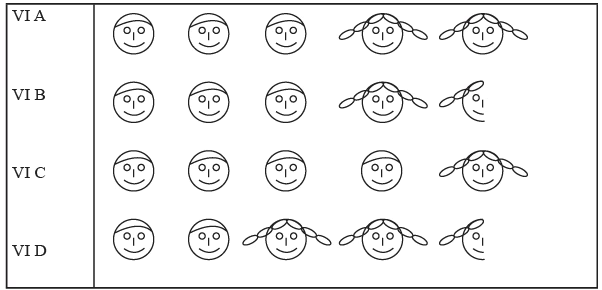
(i) How many students are there in VI A, VI B, VI C and VI D sections each? __________
(ii) Which section has maximum number of boys? __________
(iii) Which section has maximum number of girls? __________
(iv) What is the total strength of class VI? __________
Ans.
(i) VI A = 50 students
VI B = 45 students
VI C = 50 students
VI D = 45 students
(ii) Section C has the maximum number of boys.
(iii) Section D has the maximum number of girls.
(iv) Total strength of class VI is 50 + 45 + 50 + 45 = 190 Students
Q5: The number of students present in class VI during a particular week is given below. It is represented by a pictograph where 1  = 6 students.
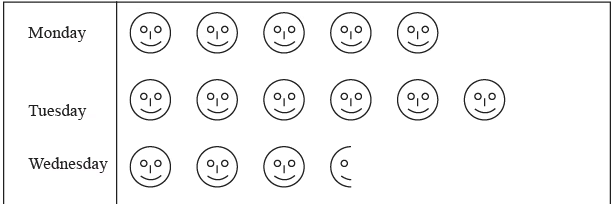
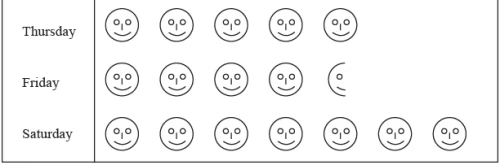
(i) On which day maximum students were present? __________
(ii) On which day minimum students were present? __________
(iii) How many students were present on wednesday and Thursday each? __________
Ans:
(i) On Saturday maximum students were present.
(ii) On Wednesday minimum students were present.
(iii) 21 students were present on Wednesday and 30 students were present on Thursday.
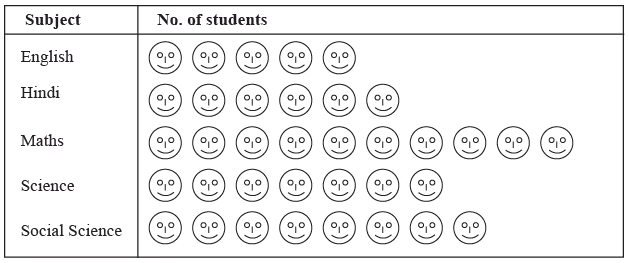
Q6: A survey showed the preference of different subjects by students of class VI
| Subject | No. of Students |
| English | 25 |
| Hindi | 30 |
| Maths | 50 |
| Science | 35 |
| Social Science | 40 |
Draw a pictograph to illustrate the above data taking a scale of 1 students.
Ans:
students.
Q7: The tally chart shows the items sold during the weekends. Use the information from the tally chart to answer the questions.
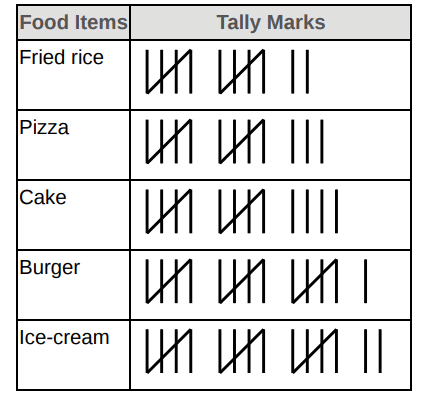
Find the following:
(a) The sale of is maximum.
(b) Fried rice were sold in all.
Ans:
Step 1: First, let us count the tally marks for each item to find the exact number
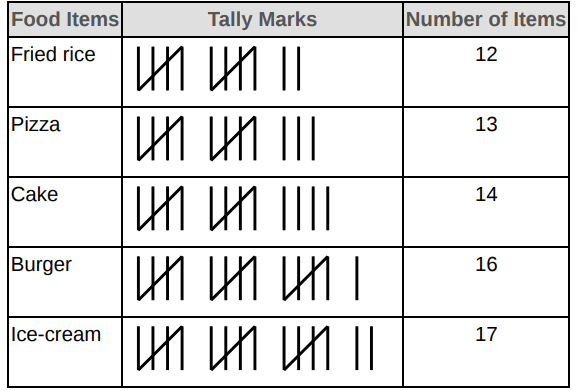
Step 2: Here, we notice that,
(a) Ice-cream have the most count, i.e., 17.
Step 3: (b) Number of Fried rice sold in all = 12
Q8: The following pictograph shows the number of pears in 6 bags
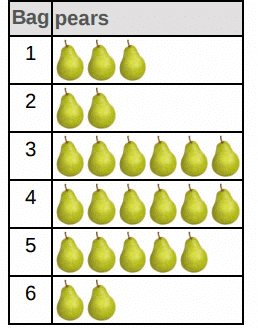 Find the following.
(a) Bag with the maximum number of pears.
(b) Bag with the minimum number of pears.
(c) Total number of pears in all the bags.
Ans:
(a) 3 and 4
(b) 2 and 6
(c) 24
Step 1 (a) It is clear from the given pictograph that there are 6 pears in the bags 3 and 4. This is the maximum number of pears in all the bags. Therefore, we can say that the bags 3,4 have the maximum number of pears.
Step 2 (b) It is clear from the given pictograph that there are 2 pears in the bags 2 and 6. This is the minimum number of pears in all the bags. Therefore, we can say that the bags 2,6 have the minimum number of pears.
Step 3 (c) Total number of pears in all the bags = Sum of the pears in all the 6 bags = 3 + 2 + 6 + 6 + 5 + 2 = 24 pears
FAQs on Worksheet Solutions: Data Handling and Presentation -2
| 1. What is data handling in Class 6? |  |
| 2. Why is it important to study data handling? | |
| 3. What are some common methods of representing data? | |
| 4. How can I collect data for a project? | |
| 5. What skills are developed through learning data handling? | |


