Data Handling | Math Olympiad for Class 5 PDF Download

Q1. A class of 20 students voted for their favorite fruit. The tally chart is given below. How many more students liked strawberries than apples?
(a) 5
(b) 6
(c) 1
(d) 4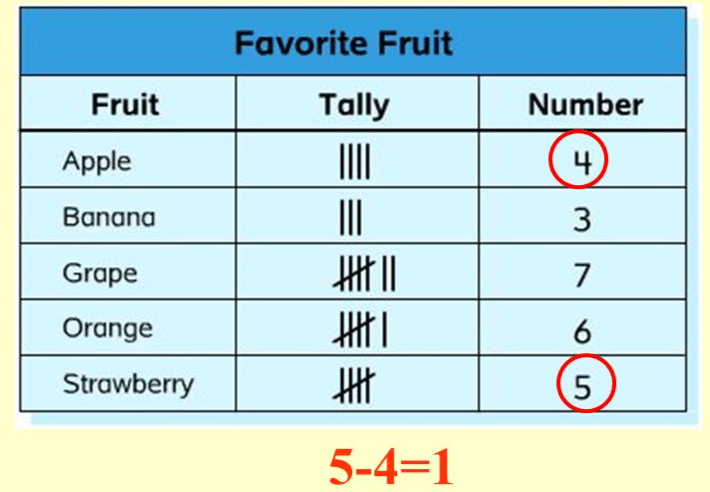 Ans: (c) 1
No. of students liked apples = 4
No. of students liked strawberries = 5
No. of students liked strawberries than apples = 5 - 4 = 1
Q2. A pictograph shows the number of books read by 4 friends. If each book symbol represents 2 books, and Priya has 3 symbols, how many books did she read?
(a) 3
(b) 6
(c) 8
(d) 5
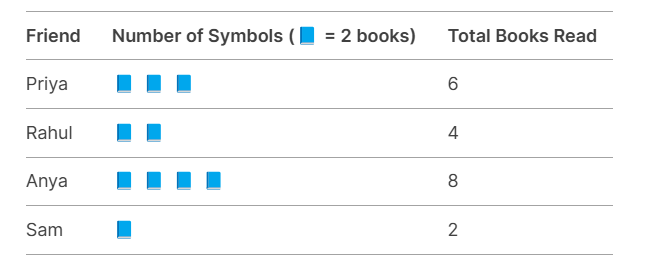
Ans: (b) 6
In a pictograph, each symbol has a value (notes use a symbol for 1 student).
Here, 1 symbol = 2 books
So 3 symbols = 3 × 2 = 6 books. Priya read 6 books.
Q3. A bar graph shows the number of ice creams sold. On which day were the fewest ice creams sold?
(a) Monday
(b) Tuesday
(c) Wednesday
(d) None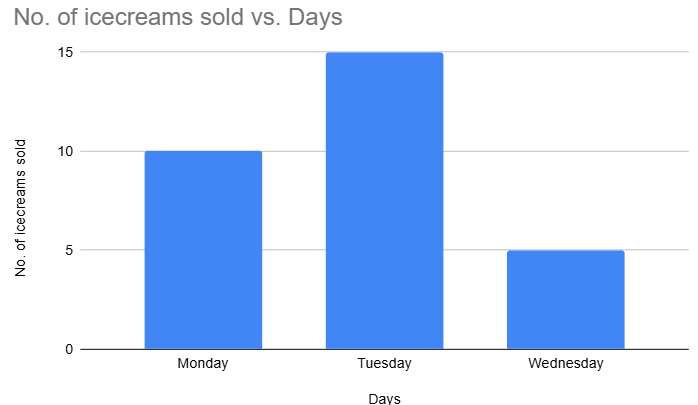
Ans: (c) Wednesday
Here, Wednesday has 5, the smallest number, so it’s the day with the fewest sales.
Q4. A double bar graph shows boys and girls liking pets. How many more girls like cats than boys?
(a) 2
(b) 3
(c) 4
(d) 1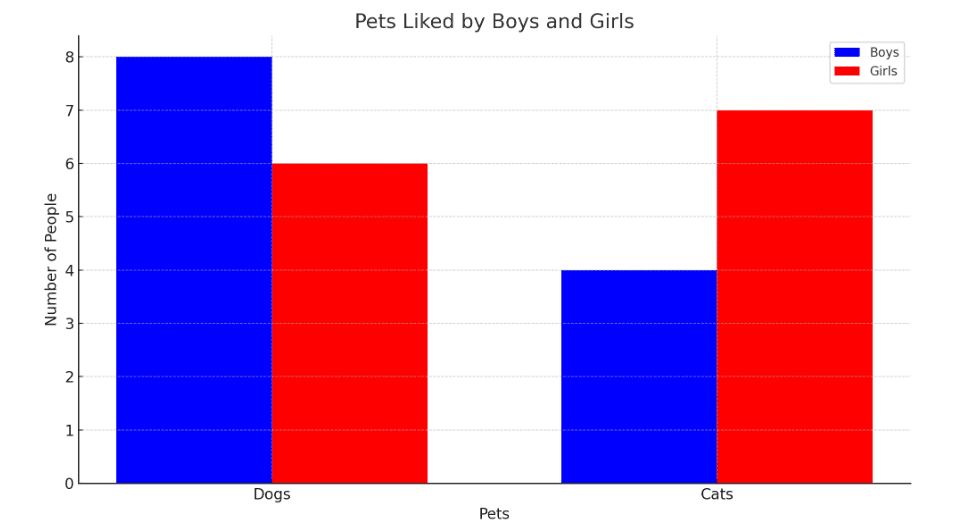
Ans: (b) 3
Girls liking cats = 7, boys = 4.
Difference = 7 - 4 = 3. So, 3 more girls like cats.
Q5. A pie chart shows favorite colors. Which color is the most popular?
(a) Blue
(b) Red
(c) Green
(d) Yellow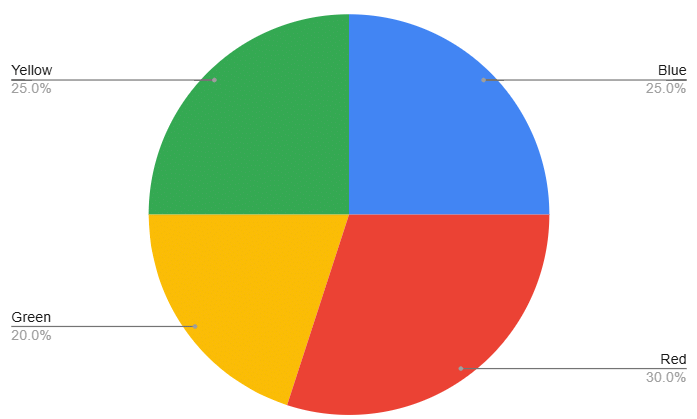
Ans: (b) Red
In a pie chart, the largest sector is the most popular one. Red has 30%, the highest percentage, so it’s the most popular.
Q6. A store sold toys.In a pictograph, if each symbol is 2 toys, how many symbols represent cars?
(a) 4
(b) 5
(c) 6
(d) 7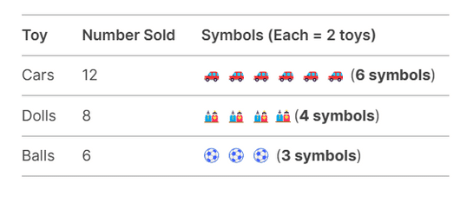
Ans: (c) 6
Here, 1 symbol = 2 toys.
Cars = 12, so 12 ÷ 2 = 6 symbols.
Cars have 6 symbols.
Q7. A line graph shows daily visitors to a park: Mon - 20, Tue - 25, Wed - 15, Thu - 30. What is the increase in visitors from Wednesday to Thursday?
(a) 10
(b) 15
(c) 5
(d) 20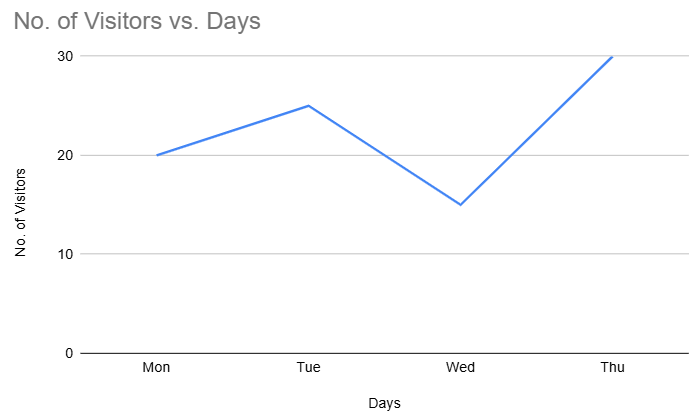
Ans: (b) 15
Thursday (30) - Wednesday (15) = 15.
The increase is 15 visitors.
Q8: A farmer counted the number of eggs collected from chickens each day for 4 days using a pictograph (each egg symbol = 3 eggs):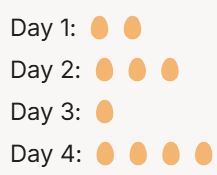
(a) 12
(b) 15
(c) 21
(d) 18
Ans: (d) 18
Calculate the eggs:
Day 1 = 2 × 3 = 6
Day 2 = 3 × 3 = 9
Day 3 = 1 × 3 = 3
Day 4 = 4 × 3 = 12.
Total = 6 + 9 + 3 + 12 = 18.
Q9. A bar graph shows juice sales. How many juices were sold altogether?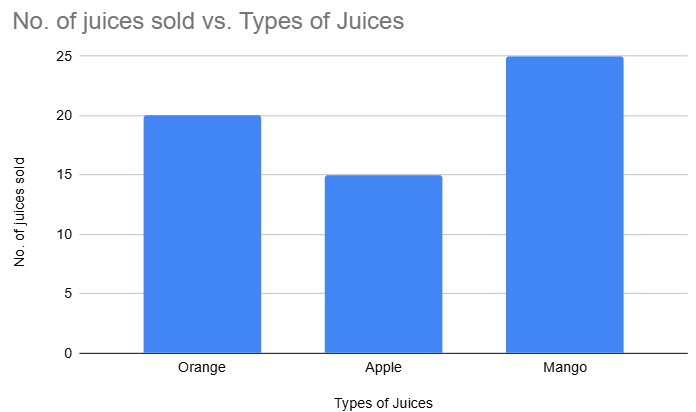
(a) 50
(b) 60
(c) 55
(d) 65
Ans: (b) 60
Here, 20 + 15 + 25 = 60. Total juices sold = 60.
Q10. A pie chart shows time spent. What percent of time is spent on school and sleep combined?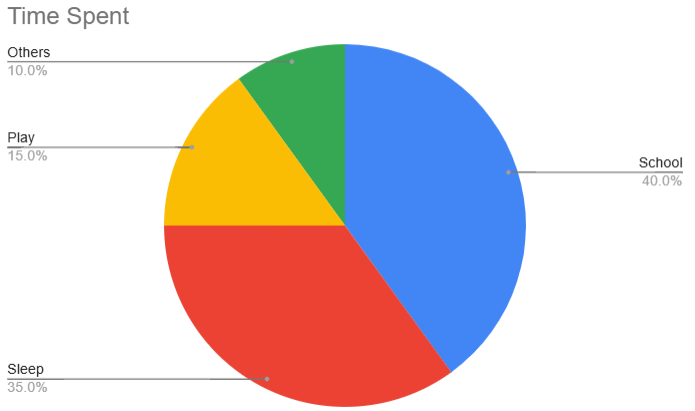
(a) 75%
(b) 70%
(c) 65%
(d) 80%
Ans: (a) 75%
School (40%) + Sleep (35%) = 75%. Combined time is 75%.
|
37 videos|109 docs|51 tests
|
FAQs on Data Handling - Math Olympiad for Class 5
| 1. What is data handling in Class 5? |  |
| 2. Why is data handling important for students? | |
| 3. What are the different types of data representation used in Class 5? | |
| 4. How can students collect data for their projects? | |
| 5. What skills do students develop through data handling activities? | |


Summary
,past year papers
,video lectures
,MCQs
,shortcuts and tricks
,Data Handling | Math Olympiad for Class 5
,Free
,mock tests for examination
,study material
,Data Handling | Math Olympiad for Class 5
,Sample Paper
,Important questions
,Semester Notes
,ppt
,Viva Questions
,Objective type Questions
,Exam
,Data Handling | Math Olympiad for Class 5
,practice quizzes
,Previous Year Questions with Solutions
,Extra Questions
;


Data Handling Free PDF Download
Importance of Data Handling
Data Handling Notes
Data Handling Class 5 Questions
Study Data Handling on the App
|
© EduRev
|
Education Revolution
|


|


within 7 days!