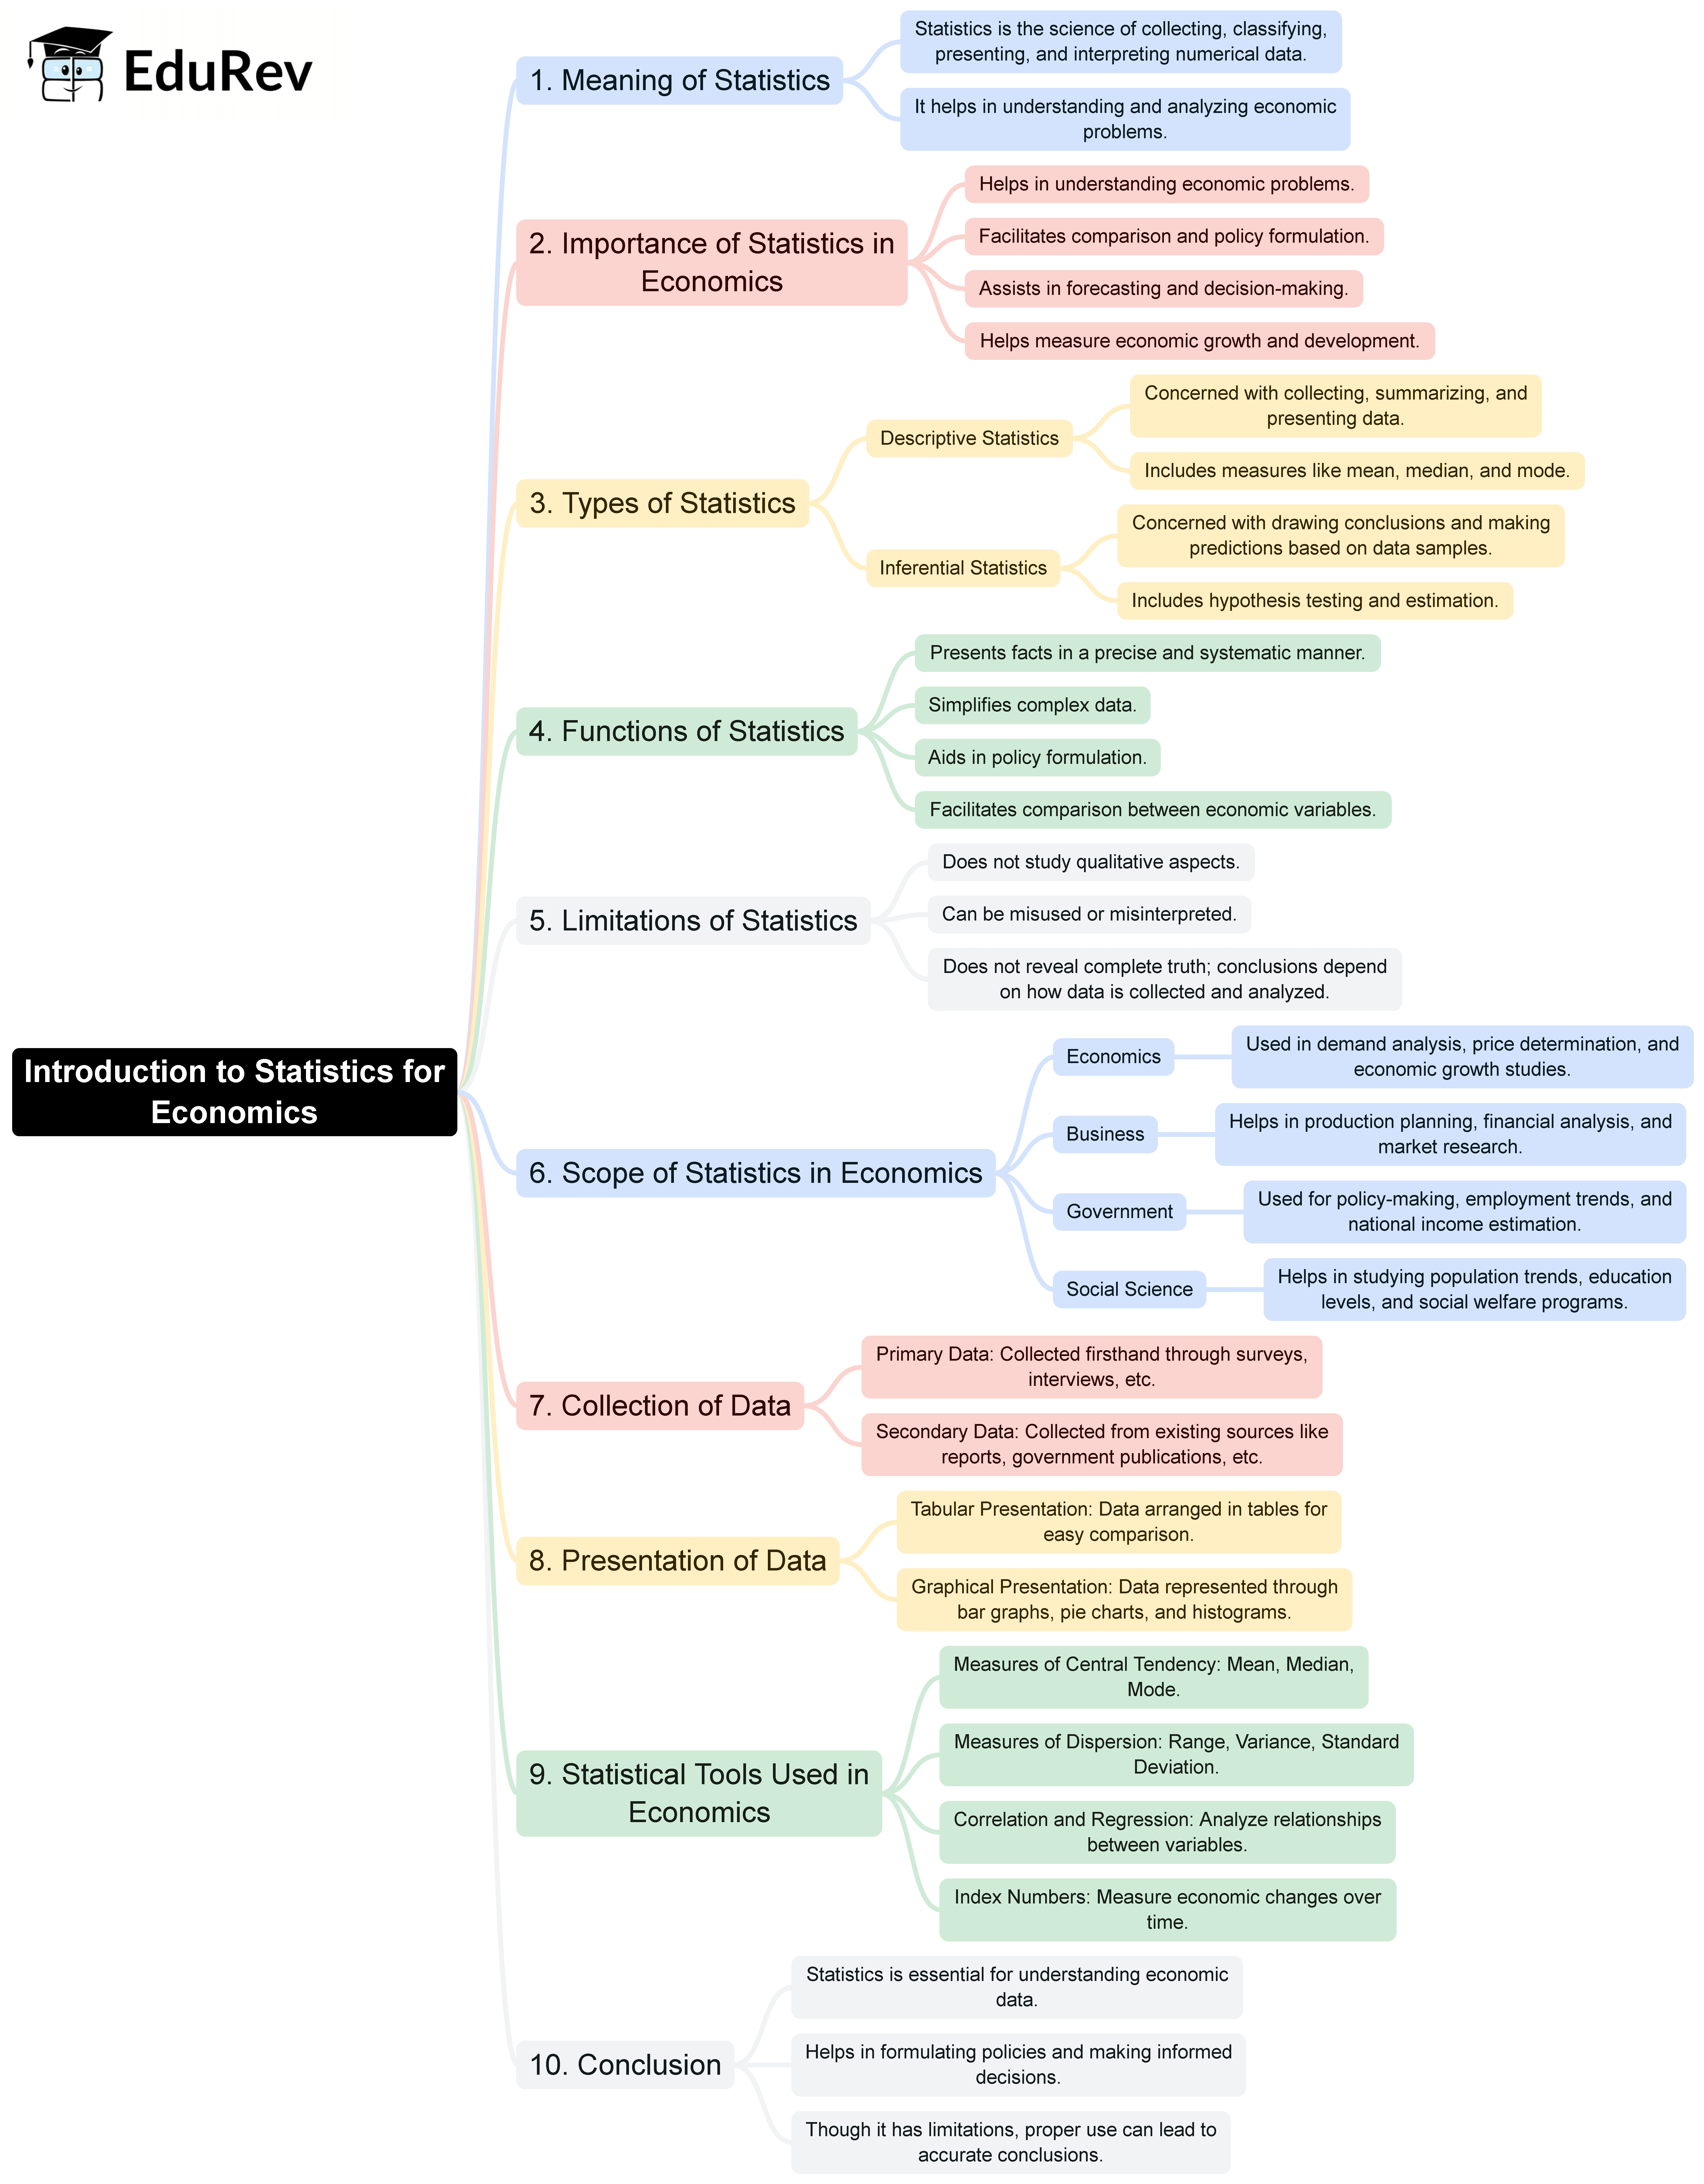
Commerce Exam > Commerce Notes > Economics Class 11 > Mind Map: Introduction to Statistics for Economics
Mind Map: Introduction to Statistics for Economics | Economics Class 11 - Commerce PDF Download

The document Mind Map: Introduction to Statistics for Economics | Economics Class 11 - Commerce is a part of the Commerce Course Economics Class 11.
All you need of Commerce at this link: Commerce
|
59 videos|222 docs|43 tests
|
FAQs on Mind Map: Introduction to Statistics for Economics - Economics Class 11 - Commerce
| 1. What is the importance of statistics in economics? |  |
Ans. Statistics plays a crucial role in economics as it helps in analyzing data, making informed decisions, and understanding economic trends. It enables economists to interpret complex data sets and assess economic policies' effectiveness. By utilizing statistical tools, economists can forecast future economic conditions, evaluate market performance, and conduct empirical research, which is vital for sound economic planning.
| 2. What are the main types of data used in economic statistics? |  |
Ans. The main types of data used in economic statistics are quantitative and qualitative data. Quantitative data consists of numerical values that can be measured and analyzed statistically, such as GDP, inflation rates, and employment figures. Qualitative data, on the other hand, includes non-numerical information that describes characteristics or qualities, such as consumer opinions and market trends. Both types of data are essential for comprehensive economic analysis.
| 3. How is descriptive statistics different from inferential statistics in economics? |  |
Ans. Descriptive statistics summarizes and describes the main features of a data set, providing simple summaries and visual representations, like graphs and charts. In contrast, inferential statistics uses sample data to make generalizations or predictions about a larger population. While descriptive statistics focuses on the "what," inferential statistics aims to answer "why" and "how," making it critical for hypothesis testing and economic modeling.
| 4. What are some common statistical methods used in economic analysis? |  |
Ans. Common statistical methods used in economic analysis include regression analysis, correlation analysis, hypothesis testing, and time series analysis. Regression analysis helps in understanding the relationship between variables, while correlation analysis assesses the strength and direction of these relationships. Hypothesis testing is used to validate or refute economic theories, and time series analysis evaluates data points over time to identify trends and patterns.
| 5. How can I improve my statistical skills for economics? |  |
Ans. To improve your statistical skills for economics, consider taking formal courses in statistics and econometrics, practicing with real economic data sets, and using statistical software like R or Stata. Reading textbooks and research papers on economic statistics can also enhance your understanding. Additionally, engaging in hands-on projects or internships that involve data analysis will provide practical experience and reinforce your learning.
Related Searches


