Humanities/Arts Exam > Humanities/Arts Notes > Informatics Practices for Class 11 > Chapter Notes: Understanding Data
Understanding Data Chapter Notes | Informatics Practices for Class 11 - Humanities/Arts PDF Download
| Table of contents |
|
| Introduction to Data |
|
| Data Collection |
|
| Data Storage |
|
| Data Processing |
|
| Statistical Techniques for Data Processing |
|

Introduction to Data
- Data is a collection of characters, numbers, and symbols representing values of situations or variables, crucial for decision-making across various fields.
- Decisions, such as choosing a college, rely on analyzing data like placement records, faculty qualifications, facilities, and fees.
- Governments collect population data through censuses to plan and formulate policies, highlighting the role of systematic data collection.
- In sports, coaching staff analyze opponent teams' past performances to devise strategies, showing data’s role in competitive planning.
- Banks maintain customer data, including account details and transactions, to manage financial operations effectively.
- Raw data alone is insufficient for decisions; it requires processing and analysis, as seen in college placement data summarized in brochures for clarity.
- Data is plural, with the singular form being "datum."
- Computers store data electronically, enabling faster and easier processing compared to manual methods.
- The ICT revolution, driven by computers, mobiles, and the internet, has led to the generation of large volumes of data at a rapid pace.
- Examples of common data include personal details (name, age, gender), transaction records, images, videos, documents, web pages, social media posts, sensor signals, and satellite data.
Importance of Data
- Data is essential for human decision-making, providing insights into possibilities or hidden patterns not visible without processing.
- Bank transactions, such as ATM withdrawals, rely on data to update account balances accurately.
- Meteorological offices monitor satellite data to predict weather events like cyclones or heavy rainfall.
- In business, companies analyze market behavior and customer feedback to adjust products or services in a competitive environment.
- Dynamic pricing in airlines, railways, and cab booking apps uses data on demand and supply to adjust prices in real-time.
- Restaurants use sales data to determine "happy hour" discounts, optimizing pricing based on time-specific sales patterns.
- Electronic voting machines record voting data, enabling quick result compilation compared to manual ballot counting.
- Scientists collect experimental data to compare results, while pharmaceutical companies track data to assess medicine effectiveness.
- Libraries maintain data on books and memberships to manage operations efficiently.
- Search engines analyze vast web data to deliver relevant search results.
- Weather alerts are generated by analyzing satellite data, aiding in disaster preparedness.
Types of Data
- Data varies by source and format, such as images (pixels), videos (frames), fee slips (numeric and non-numeric entries), or messages (text, emoticons, images).
- Data is classified into two broad categories based on format: structured and unstructured.
Structured Data
- Structured data is organized and recorded in a well-defined format, typically stored in tabular form (rows and columns) in computers.
- Each column represents an attribute, characteristic, or variable, while each row represents an observation’s data for those attributes.
- Example: A shop’s kitchen inventory table includes columns like ModelNo, ProductName, Unit Price, Discount, and Items_in_Inventory.
- Using software like spreadsheets, shop owners can calculate total items by summing the Items_in_Inventory column or compute total inventory value by multiplying Unit Price by Items_in_Inventory and summing the results.
- Other examples include bookshop data (BookTitle, Author, Price, YearofPublication), school fee deposits (StudentName, Class, RollNo, FeesAmount, DepositDate), and ATM withdrawals (AccHolderName, AccountNo, TypeofAcc, DateofWithdrawal, AmountWithdrawn, ATMid, TimeOfWithdrawal).
Unstructured Data
- Unstructured data lacks a traditional row-and-column structure and does not follow a fixed pattern or format.
- Example: Newspapers have no fixed layout, with varying numbers of images, news items, and advertisements daily.
- Emails lack a fixed structure regarding lines, paragraphs, or attachments.
- Other examples include web pages (text and multimedia), text documents, business reports, books, audio/video files, and social media messages.
- Unstructured data is often described using metadata (data about data), such as email components (subject, recipient, body, attachment) or image file details (size, type, resolution).
- This book focuses on handling structured data, though methods exist to process unstructured data.
Data Collection
- Data collection involves identifying or gathering data from appropriate sources for processing and storage in files or databases.
- Example scenarios for grocery store sales data include:
- Data recorded in a diary/register, requiring entry into a digital format like a spreadsheet.
- Data already in digital format, such as a CSV file.
- No recorded data, but the shopkeeper wants software (e.g., using Python) to store and retrieve data in CSV or a DBMS like MySQL.
- Digital interactions generate vast data volumes, such as hospital patient data for service improvement or shopping mall purchase data for sales strategies.
- Analyzing purchase patterns (e.g., bedsheets and groceries bought together) can lead to strategic product placement to boost sales.
- Political analysts use social media data to gauge public opinion before elections.
- Organizations like the World Bank and IMF collect economic data from countries for forecasting.
Data Storage
- Data storage involves saving data on devices for future retrieval, a challenging task due to the high volume and rate of data generation.
- Decreasing costs of digital storage devices, such as HDD, SSD, CD/DVD, tape drives, pen drives, and memory cards, have simplified storage.
- Data like images, documents, and audio/videos are stored as files on computers, while school/hospital data are stored in data files.
- Computers allow adding, modifying, or deleting data in files and processing them to obtain results.
- File processing has limitations, which can be addressed using Database Management Systems (DBMS).
Data Processing
- Data processing transforms raw data into meaningful information for decision-making, as large datasets alone cannot yield conclusions.
- Automated data processing is used in online bill payments, complaint registrations, and ticket bookings.
- The data processing cycle includes input, storage, processing, and output generation.
- Examples of data processing tasks:
- Online examination form: Inputs include student details, qualifications, marks, and payment details; processing verifies data correctness, eligibility, and fees, generating a roll number and admit card.
- ATM withdrawal: Inputs include PIN, account details, and withdrawal amount; processing checks PIN validity and balance, deducting the amount and issuing currency and a receipt.
- Train ticket issuance: Inputs include journey details, passenger info, and payment; processing checks availability and confirms booking, issuing a ticket.
Statistical Techniques for Data Processing
- Statistical techniques summarize tabular data for easier comprehension, revealing data characteristics.
- Common techniques include measures of central tendency (mean, median, mode) and measures of variability (range, standard deviation).
Measures of Central Tendency
- These provide a single value summarizing the data, with the choice of measure depending on data characteristics.
Mean
- Mean is the average of numeric values for an attribute, calculated as the sum of values divided by the number of values.
- Formula: For n values
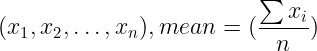 .
. - Example: Heights (in cm) [90, 102, 110, 115, 85, 90, 100, 110, 110] yield a mean of \( \frac{912}{9} = 101.33 \) cm.
- Mean is sensitive to outliers (exceptionally large or small values), which may need removal to avoid skewing results.
- Outliers are often considered errors as they affect statistical calculations like the mean.
Median
- Median is the middle value when data is sorted in ascending or descending order, dividing the dataset into two equal parts.
- For an odd number of values, the median is the middle value; for an even number, it’s the average of the two middle values.
- Example: Sorted heights [85, 90, 90, 100, 102, 110, 110, 110, 115] (9 values) give a median of 102 cm (5th value).
- Median is less affected by outliers, making it suitable for skewed datasets.
Mode
- Mode is the value with the highest frequency in the dataset, applicable to both numeric and non-numeric data.
- A dataset may have no mode (if all values occur once) or multiple modes (if multiple values share the highest frequency).
- Example: In the height dataset, the mode is 110 cm, appearing three times.
Measures of Variability
- These measures, also called measures of dispersion, indicate the spread or variation of data around the mean.
- Two datasets may have identical mean, median, or mode but differ in dispersion, or vice versa.
- Common measures are range and standard deviation.
Range
- Range is the difference between the maximum and minimum values in a dataset, applicable only to numerical data.
- Formula: Range = Maximum - Minimum.
- Example: For heights (min = 85 cm, max = 115 cm), range = (115 - 85 = 30) cm.
- Range is sensitive to outliers, as it relies on extreme values, potentially misrepresenting data spread.
Standard Deviation
- Standard deviation measures data spread by calculating the positive square root of the average of squared differences from the mean.
- Unlike range, it considers all data points, providing a more comprehensive measure of variability.
- Formula: For n values (x1, x2, ...xn) with mean
 , standard deviation
 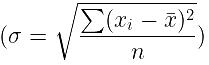 .
. - Example: For heights with mean 101.33 cm, squared differences sum to 938, so standard deviation =
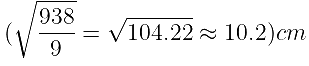 .
. - Smaller standard deviation indicates less spread, while a larger value indicates greater spread.
Summary
- Data are unorganized facts that, when processed, generate meaningful information.
- Data can be structured (organized in rows and columns) or unstructured (lacking a fixed format).
- Common storage devices include Hard Disk, SSD, CD/DVD, Pen Drive, and Memory Card.
- The data processing cycle involves input, storage, processing, and output generation.
- Statistical techniques like summarization reveal data characteristics for easier understanding.
- Mean is the average of values, median is the middle value in sorted data, and mode is the most frequent value.
- Range is the difference between maximum and minimum values, while standard deviation measures spread using all data points.
The document Understanding Data Chapter Notes | Informatics Practices for Class 11 - Humanities/Arts is a part of the Humanities/Arts Course Informatics Practices for Class 11.
All you need of Humanities/Arts at this link: Humanities/Arts
FAQs on Understanding Data Chapter Notes - Informatics Practices for Class 11 - Humanities/Arts
| 1. What is the importance of data in decision-making? |  |
Ans.Data plays a crucial role in decision-making as it provides the necessary information and insights that help organizations understand trends, make informed choices, and evaluate performance. Accurate data allows businesses to identify opportunities, optimize processes, and enhance customer satisfaction.
| 2. What are the main types of data? | |
Ans.The main types of data are structured and unstructured data. Structured data is organized and easily searchable, often stored in databases and spreadsheets. Unstructured data, on the other hand, is not organized in a predefined manner, including text, images, and videos, making it more challenging to analyze.
| 3. What is unstructured data, and why is it significant? | |
Ans.Unstructured data refers to information that does not have a predefined format or structure. It includes emails, social media posts, videos, and more. This type of data is significant because it contains valuable insights and information that can be leveraged for analytics, market research, and improving customer experiences.
| 4. How do you calculate the median of a data set? | |
Ans.To calculate the median, you first need to arrange the data set in ascending order. If there is an odd number of values, the median is the middle number. If there is an even number of values, the median is the average of the two middle numbers. This measure helps to understand the central tendency of the data.
| 5. What does the range of a data set indicate? | |
Ans.The range of a data set indicates the difference between the highest and lowest values. It provides a measure of statistical dispersion, showing how spread out the values are. A larger range suggests greater variability in the data, while a smaller range indicates that the values are more closely clustered.
About this Document

4.92/5
Rating

Oct 20, 2025
Last updated
Related Exams
Document Description: Chapter Notes: Understanding Data for Humanities/Arts 2025 is part of Informatics Practices for Class 11 preparation.
The notes and questions for Chapter Notes: Understanding Data have been prepared according to the Humanities/Arts exam syllabus. Information about Chapter Notes: Understanding Data covers topics
like Introduction to Data, Data Collection, Data Storage, Data Processing, Statistical Techniques for Data Processing and Chapter Notes: Understanding Data Example, for Humanities/Arts 2025 Exam. Find important definitions, questions, notes, meanings, examples, exercises and tests below for Chapter Notes: Understanding Data.
Introduction of Chapter Notes: Understanding Data in English is available as part of our Informatics Practices for Class 11
for Humanities/Arts & Chapter Notes: Understanding Data in Hindi for Informatics Practices for Class 11 course.
Download more important topics related with notes, lectures and mock test series for Humanities/Arts
Exam by signing up for free. Humanities/Arts: Understanding Data Chapter Notes | Informatics Practices for Class 11 - Humanities/Arts
Description
Full syllabus notes, lecture & questions for Understanding Data Chapter Notes | Informatics Practices for Class 11 - Humanities/Arts - Humanities/Arts | Plus excerises question with solution to help you revise complete syllabus for Informatics Practices for Class 11 | Best notes, free PDF download
Information about Chapter Notes: Understanding Data
In this doc you can find the meaning of Chapter Notes: Understanding Data defined & explained in the simplest way possible. Besides explaining types of
Chapter Notes: Understanding Data theory, EduRev gives you an ample number of questions to practice Chapter Notes: Understanding Data tests, examples and also practice Humanities/Arts
tests

Related Searches
Exam
,Understanding Data Chapter Notes | Informatics Practices for Class 11 - Humanities/Arts
,ppt
,shortcuts and tricks
,Free
,Viva Questions
,mock tests for examination
,video lectures
,practice quizzes
,Summary
,Important questions
,Extra Questions
,study material
,Objective type Questions
,Previous Year Questions with Solutions
,Understanding Data Chapter Notes | Informatics Practices for Class 11 - Humanities/Arts
,Sample Paper
,MCQs
,past year papers
,Understanding Data Chapter Notes | Informatics Practices for Class 11 - Humanities/Arts
,Semester Notes
;


Additional Information about Chapter Notes: Understanding Data for Humanities/Arts Preparation
Chapter Notes: Understanding Data Free PDF Download
The Chapter Notes: Understanding Data is an invaluable resource that delves deep into the core of the Humanities/Arts exam.
These study notes are curated by experts and cover all the essential topics and concepts, making your preparation more efficient and effective.
With the help of these notes, you can grasp complex subjects quickly, revise important points easily,
and reinforce your understanding of key concepts. The study notes are presented in a concise and easy-to-understand manner,
allowing you to optimize your learning process. Whether you're looking for best-recommended books, sample papers, study material,
or toppers' notes, this PDF has got you covered. Download the Chapter Notes: Understanding Data now and kickstart your journey towards success in the Humanities/Arts exam.
Importance of Chapter Notes: Understanding Data
The importance of Chapter Notes: Understanding Data cannot be overstated, especially for Humanities/Arts aspirants.
This document holds the key to success in the Humanities/Arts exam.
It offers a detailed understanding of the concept, providing invaluable insights into the topic.
By knowing the concepts well in advance, students can plan their preparation effectively.
Utilize this indispensable guide for a well-rounded preparation and achieve your desired results.
Chapter Notes: Understanding Data
Chapter Notes: Understanding Data Notes offer in-depth insights into the specific topic to help you master it with ease.
This comprehensive document covers all aspects related to Chapter Notes: Understanding Data.
It includes detailed information about the exam syllabus, recommended books, and study materials for a well-rounded preparation.
Practice papers and question papers enable you to assess your progress effectively.
Additionally, the paper analysis provides valuable tips for tackling the exam strategically.
Access to Toppers' notes gives you an edge in understanding complex concepts.
Whether you're a beginner or aiming for advanced proficiency, Chapter Notes: Understanding Data Notes on EduRev are your ultimate resource for success.
Chapter Notes: Understanding Data Humanities/Arts Questions
The "Chapter Notes: Understanding Data Humanities/Arts Questions" guide is a valuable resource for all aspiring students preparing for the
Humanities/Arts exam. It focuses on providing a wide range of practice questions to help students gauge
their understanding of the exam topics. These questions cover the entire syllabus, ensuring comprehensive preparation.
The guide includes previous years' question papers for students to familiarize themselves with the exam's format and difficulty level.
Additionally, it offers subject-specific question banks, allowing students to focus on weak areas and improve their performance.
Study Chapter Notes: Understanding Data on the App
Students of Humanities/Arts can study Chapter Notes: Understanding Data alongwith tests & analysis from the EduRev app,
which will help them while preparing for their exam. Apart from the Chapter Notes: Understanding Data,
students can also utilize the EduRev App for other study materials such as previous year question papers, syllabus, important questions, etc.
The EduRev App will make your learning easier as you can access it from anywhere you want.
The content of Chapter Notes: Understanding Data is prepared as per the latest Humanities/Arts syllabus.
|
© EduRev
|
Education Revolution
|


|


Signup to see your scores
go up within 7 days!
Access 1000+ FREE Docs, Videos and Tests
Takes less than 10 seconds to signup