Let's Explore: Understanding the Weather


Page 28: Weather and its Elements
Q: What are some of the words in your local language that you use to describe the weather? Hot, cold, warm, chilly, crisp, pleasant, and so on, are commonly used terms in English.
Ans: Words in local languages to describe weather vary by region and language. For example:
- In Hindi: garm (hot), thanda (cold), sukha (dry), bheega (wet), halka (mild).
- In Tamil: veppam (hot), kulir (cold), mazhai (rainy), vearvai (humid).
- In Bengali: garom (hot), thanda (cold), bristi (rainy), sokha (dry).
- These terms, like the English examples (hot, cold, warm, chilly, crisp, pleasant), reflect local perceptions of temperature, precipitation, and humidity, tailored to regional climate and culture.
Page 29 & 30: Weather and its Elements
Q: What do you think could be some other reasons to measure the weather more precisely?
(Hint: Think how knowing the weather a few hours or a few days in advance would help you plan some activities.)
Ans: Precise weather measurement is crucial for:
- Agriculture: Farmers plan sowing, irrigation, and harvesting based on forecasts to avoid crop damage from rain, drought, or frost.
- Aviation and Navigation: Pilots and sailors need accurate wind, pressure, and visibility data for safe travel.
- Disaster Preparedness: Early warnings for storms, cyclones, or heatwaves allow governments to evacuate people or distribute resources.
- Daily Planning: Individuals plan outdoor activities like picnics, sports, or travel, choosing appropriate clothing or rescheduling to avoid adverse weather.
- Industry: Sectors like construction, energy (e.g., wind farms), and food processing rely on weather data to optimize operations.
- Knowing the weather in advance helps mitigate risks, enhance safety, and improve efficiency in these activities.
Q: Talk to elders in your neighbourhood and ask them how they predict the weather. What signs do they observe? Document any sayings in your regional language that refer to weather prediction.
Ans: Weather Prediction by Elders - A Local Study
I spoke to some elders in my neighborhood to understand how they predict the weather using traditional knowledge and signs from nature. Here are some common observations and sayings:
Observed Signs
Cloud patterns: Dark clouds gathering in the west often mean rain is coming soon.
Animal behavior: Ants moving in long lines or birds flying low are seen as signs of upcoming rain.
Smell in the air: Some elders say they can "smell" rain-often described as an earthy scent.
Pain in joints: Older people with arthritis often say their joints ache before it rains.
Wind direction and temperature: A sudden cool breeze is often taken as a sign of an approaching storm.
Regional Sayings (in Hindi, from North India)
"Aasman mein laalima, subah barsaat ka waada"
(If the sky is red at dawn, it's a sign of rain during the day.)"Koyal jhoome saawan aaye"
(When the koel sings joyfully, the monsoon is near.)"Chinti chale rekh banaaye, jaldi hi badal chhaaye"
(When ants walk in a line, clouds will cover the sky soon.)
Page 32 & 33: Weather Instruments
Q: Here's a chart of the temperatures of a city in Madhya Pradesh. What is the maximum temperature recorded in the week shown here? What is the minimum? Calculate the range.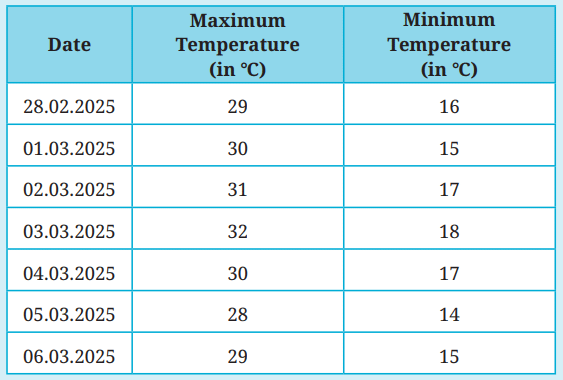
Ans: Using the above temperature chart provided for a city in Madhya Pradesh :
- Maximum Temperature Recorded: 32°C (on 03.03.2025).
- Minimum Temperature Recorded: 14°C (on 05.03.2025).
- Range Calculation: Range = Maximum Temperature - Minimum Temperature = 32°C - 14°C = 18°C.
Q: Remember the conversation between Krishnan and Amir? If Krishnan said it was 20°C in Chennai and he was feeling a little cold, he and Amir would have a measure they could understand. What do you think Amir's reaction to Krishnan's statement might be?
Ans: Amir, living in Kashmir where temperatures are typically lower (e.g., 6.5°C in Srinagar), might find Krishnan's statement surprising or amusing. At 20°C, Chennai is relatively warm compared to Kashmir's colder climate. Amir might react by saying something like, "20°C is warm for us in Kashmir! That's like a pleasant spring day here, not cold!" He might explain that in Kashmir, temperatures below 0°C are common in winter, so 20°C feels comfortable or even warm to him.
Page 34: Weather Instruments
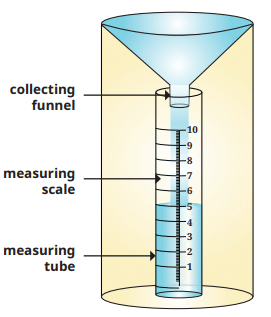
Q: Make a rain gauge as shown in the diagram above. Place the rain gauge in an open area, away from objects that might obstruct rain. Ensure that the rain gauge is on a flat surface and will not tilt or topple with the wind. Using the measuring scale, record the amount of rainwater collected at the same time every day, for a month. (If there is snow, allow it to melt before taking the measurement.) Calculate the average rainfall for every week in that month and comment on the variation from week to week.
Ans: Procedure:
- Construct a rain gauge using a funnel and a graduated cylinder as shown in Fig below. Place it in an open area (e.g., a school field) free from trees, buildings, or other obstructions to ensure accurate rainfall collection. Secure it on a flat, stable surface to prevent tilting or toppling due to wind.
- Record the depth of rainwater (in mm) daily at a fixed time (e.g., 8 AM) for a month. If snow falls, let it melt before measuring.
- For each week, sum the daily rainfall measurements and divide by 7 to calculate the average weekly rainfall.
 Rain Gauge
Example Calculation(assuming hypothetical data for a month):
- Week 1: Daily readings (mm) = 2, 0, 3, 5, 0, 1, 0; Total = 11 mm; Average = 11/7 ≈ 1.57 mm.
- Week 2: Daily readings = 10, 8, 0, 0, 2, 3, 1; Total = 24 mm; Average = 24/7 ≈ 3.43 mm.
- Week 3: Daily readings = 0, 0, 0, 1, 0, 0, 0; Total = 1 mm; Average = 1/7 ≈ 0.14 mm.
- Week 4: Daily readings = 5, 4, 6, 0, 2, 3, 1; Total = 21 mm; Average = 21/7 = 3 mm.
- Variation Comment: The rainfall varies significantly week to week. Week 3 shows the lowest rainfall (0.14 mm), indicating a dry period, while Week 2 has the highest (3.43 mm), suggesting a wetter period, possibly due to a monsoon shower or storm. Weeks 1 and 4 have moderate rainfall, indicating more stable but still variable conditions. Such variations could reflect seasonal shifts or local weather patterns.
Page 35 & 36: Think About It
Q: Why do you think it would be important to measure atmospheric pressure? Who are the people most likely to use such measurements?
Ans: Measuring atmospheric pressure is important because it helps us understand and predict weather patterns. Changes in atmospheric pressure can indicate upcoming storms, fair weather, or changes in temperature, making it crucial for planning and safety.
The people most likely to use these measurements include:
Meteorologists, who study and forecast the weather
Pilots and air traffic controllers, to ensure safe flight conditions
Sailors and fishermen, who need to know about changing weather at sea
Mountaineers and hikers, especially at high altitudes where pressure affects oxygen levels
Q: Have you seen seeds like these flying in the wind? What would happen to the seeds if there was no wind?
Ans: Yes, many people have seen seeds like dandelion or maple seeds flying in the wind. These seeds are designed to be carried by the wind to new locations so they can grow away from the parent plant. Seeds
Seeds
If there were no wind, the seeds would simply fall to the ground near the parent plant. This would lead to overcrowding, more competition for sunlight, water, and nutrients, and a lower chance of survival for the new plants.
Page 37: Weather Instruments
Q: Where do you think humidity is likely to be more, Kochi or Jaipur? You might guess that Kochi has higher humidity than Jaipur because it is located near the sea. But how will we know for sure? If we had to compare the humidity level between Kochi and Mangaluru, how would we do it? Discuss with your classmates.
Ans: Kochi vs. Jaipur Humidity:
- Kochi, located on the coastal plain near the Arabian Sea in Kerala, is likely to have higher humidity due to its proximity to the sea, which increases water vapor in the air. Typical relative humidity in Kochi is around 70-90%, especially during the monsoon.
- Jaipur, located in the arid Thar Desert region of Rajasthan, experiences lower humidity, often ranging from 20-50%, due to its inland, dry climate.
Confirming Humidity Levels:
- To know for sure, use a hygrometer to measure relative humidity in both cities at the same time of day over a period (e.g., a week) to account for daily variations. Compare the average readings.
Comparing Kochi and Mangaluru:
- Both Kochi and Mangaluru are coastal cities (Kochi in Kerala, Mangaluru in Karnataka) along the Arabian Sea, so both have high humidity (70-90%).
- Measure relative humidity using hygrometers in both cities simultaneously, ideally at multiple times daily (e.g., morning, noon, evening) for a week. Record data and calculate averages.
- Differences may arise due to local factors like rainfall frequency (Mangaluru may have slightly higher humidity during monsoon due to heavier rainfall) or urban heat in Kochi. Comparing data with classmates can confirm which city has higher humidity and by how much.
Page 38: Think About It
Q: If the humidity in Delhi is at 52% while in Kochi it is 84%, in which of the two places are wet clothes likely to dry faster? And where are you likely to sweat more, assuming the temperature is the same in both places?
Ans: Wet clothes are likely to dry faster in Delhi because the humidity is lower (52%). Lower humidity means the air can absorb more moisture, allowing water to evaporate from the clothes more quickly.
You're likely to sweat more in Kochi, or at least feel sweatier, even though the temperature is the same. This is because high humidity (84%) slows down the evaporation of sweat, making it harder for your body to cool off. As a result, sweat stays on your skin and you feel more uncomfortable.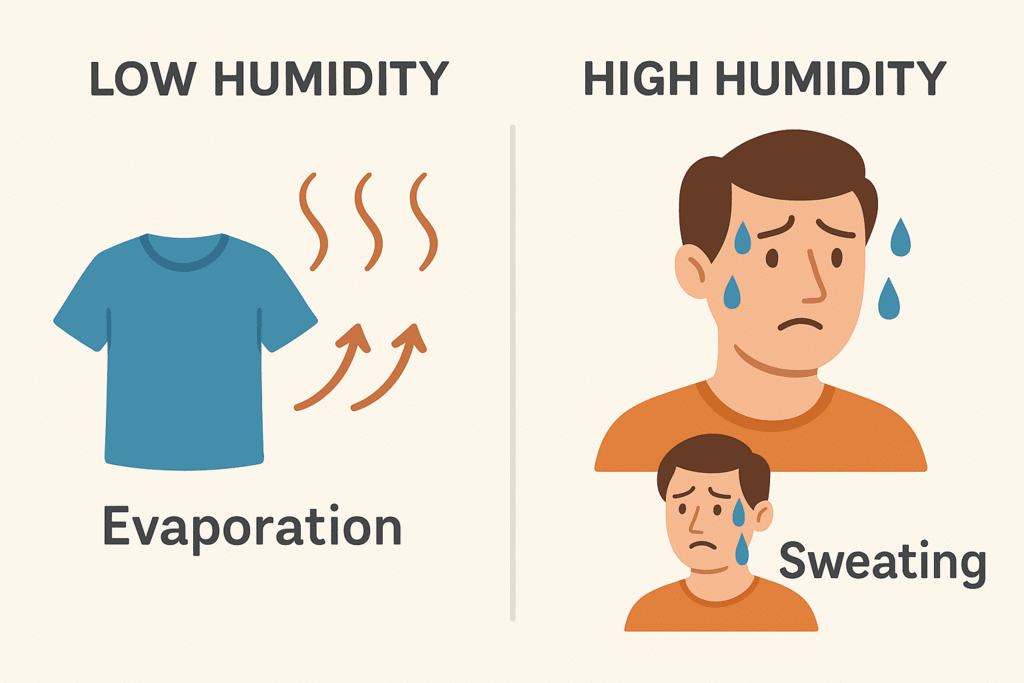 Humidity
Page 41: Predicting the Weather
Q: Discuss, in pairs, different situations in which weather predictions are helpful. Make a list, and after you have completed it, share it and discuss it with the pair sitting next to you. How many different categories of situations have you been able to identify?
Ans: Situations Where Weather Predictions Are Helpful:
- Agriculture: Farmers use forecasts to plan planting, irrigation, and harvesting to avoid crop damage from rain, frost, or heat waves.
- Aviation: Pilots rely on wind, visibility, and storm predictions for safe takeoffs, landings, and route planning.
- Marine Navigation: Fishermen and sailors avoid venturing out during storms or cyclones based on warnings, ensuring safety.
- Disaster Management: Governments prepare for floods, cyclones, or droughts by evacuating people, stocking supplies, or building shelters.
- Daily Life: Individuals plan outdoor activities (e.g., picnics, weddings, sports) or choose appropriate clothing based on temperature and rainfall forecasts.
- Infrastructure Planning: Construction projects schedule work to avoid heavy rain or extreme heat, ensuring worker safety and project quality.
- Energy Sector: Wind and solar energy producers use wind speed and sunlight forecasts to optimize power generation.
- Tourism: Tourists plan trips to avoid adverse weather, ensuring enjoyable experiences.
Categories Identified:
- Agriculture, Transportation (Aviation, Marine), Disaster Management, Personal Planning, Infrastructure, Energy, Tourism.
- Total Categories: 7.
Discussion: Sharing with another pair may reveal additional situations (e.g., health planning for heatwaves or allergies) or refine categories, potentially increasing the count or merging similar ones (e.g., aviation and marine into transportation).
Q: What do you observe happening on that day? What are the various weather conditions that the IMD is alerting people to? Which states have warning signs? Which parts of India are likely to be free from severe weather? Which states are likely to face heat wave conditions? What are the causes for warning in Tripura and Lakshadweep?
Ans: Using the India Meteorological Department (IMD) weather warning map for 19 May 2024:
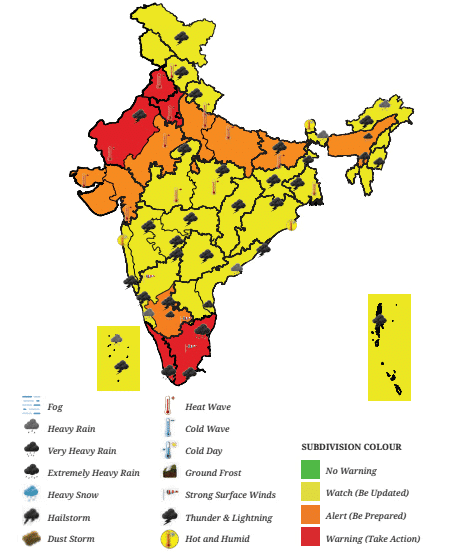
Observations: The map shows varied weather conditions across India, with warning icons indicating severe weather in some regions and milder conditions in others.
Weather Conditions Alerted by IMD:
- Heatwaves in northern and central India.
- Heavy rainfall or thunderstorms in northeastern and southern coastal regions.
- Strong winds or potential cyclonic activity in coastal areas.
States with Warning Signs:
- Northern/Central India: Rajasthan, Uttar Pradesh, Madhya Pradesh, Haryana, Punjab (likely heatwave warnings).
- Northeastern India: Tripura, Assam, Meghalaya (likely heavy rainfall or thunderstorms).
- Southern/Coastal India: Lakshadweep, Kerala, Tamil Nadu, Andhra Pradesh (likely rainfall or cyclonic activity).
Parts Likely Free from Severe Weather:
- Western states like Gujarat and parts of Maharashtra, and some central regions like Chhattisgarh, may show fewer or no warning icons, indicating relatively stable weather (e.g., clear skies or mild temperatures).
States Facing Heatwave Conditions:
- Rajasthan, Uttar Pradesh, Madhya Pradesh, Haryana, Punjab, and possibly Delhi, where high temperatures are common in May.
Causes for Warnings in Tripura and Lakshadweep:
- Tripura: Likely heavy rainfall or thunderstorms due to monsoon activity or a low-pressure system in the Bay of Bengal, common in northeastern India during May.
- Lakshadweep: Likely heavy rainfall or strong winds due to cyclonic activity or pre-monsoon showers in the Arabian Sea, affecting coastal and island regions.
FAQs on Let's Explore: Understanding the Weather


