Population & Migration Chapter Notes | Geography for Grade 9 PDF Download
| Table of contents |
|
| Introduction |
|
| What determines where people live? |
|
| Types of Densities |
|
| Why People Move |
|

Introduction
This chapter introduces the study of population and migration, exploring why over 7 billion people live where they do across the globe. Despite advancements in living conditions and healthcare access, most people reside in low-income developing countries. This unit addresses a fundamental yet captivating question: Why do people choose to live in specific locations? It examines physical and human factors influencing settlement patterns, types of population densities, and the Demographic Transition Model. The chapter also delves into push and pull factors driving migration and the role of population pyramids in understanding demographic trends.
What determines where people live?
Physical Factors
- Consider the area where you live. What makes a city or country an appealing or unappealing place to reside? You might think about the region’s climate, proximity to water bodies, or the presence of significant geographic features like mountain ranges.
- Access to food is essential for survival, leading to the development of cities in fertile valleys and near rivers. The majority of the world’s population lives in midlatitudes (between 30°N and 60°N and between 30°S and 60°S), which offer temperate climates and fertile soils, making them desirable for settlement.
- Additionally, people prefer low-lying areas over high mountainous regions. Low-lying areas typically have richer soils and are often located near oceans or other water bodies. Freshwater sources, such as lakes and rivers, also attract populations to these regions.
Human Factors
- While physical factors like food and water are critical, they alone are insufficient to draw people to an area in the modern world.
- Individuals also seek safety, employment opportunities, and proximity to family members.
Types of Densities
Demographers analyze three types of population density: arithmetic, physiological, and agricultural population density.
- Arithmetic Population Density: This density measures the average number of people per unit area. For example, the United States has a population of 330 million spread across 3,841,999 square miles, resulting in an arithmetic density of approximately 84 people per square mile.
- Physiological Population Density: Unlike arithmetic density, this is calculated by dividing the total population by the amount of arable land available. It represents the number of people supported by land suitable for agriculture in a given area.
- Agricultural Population Density: This density compares the number of farmers to the area of arable land. A lower number of farmers per unit of arable land often indicates higher agricultural efficiency, as fewer people are needed to produce the same amount of food.
Population Pyramids
Population pyramids are graphical representations that display the age and gender distribution of a country’s population. These diagrams provide insights into birth rates, death rates, economic development, and education levels within a country. 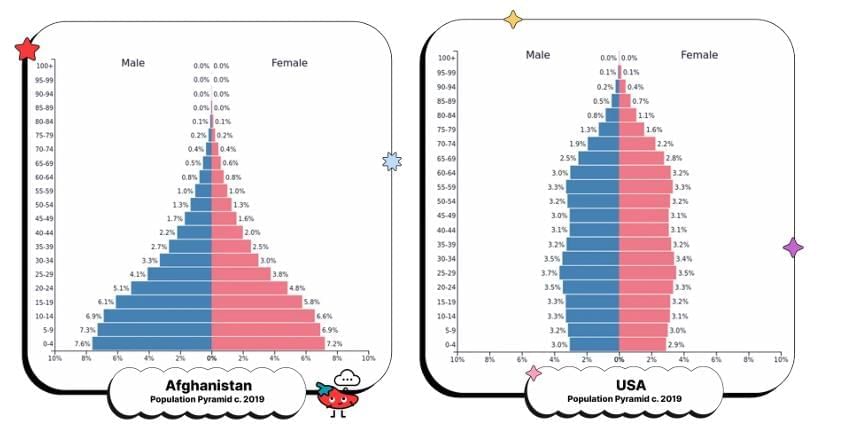
Population Growth and Decline
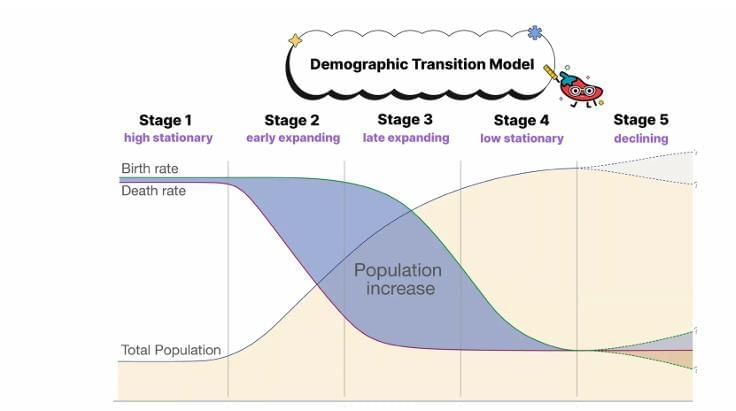
- A country’s population can vary significantly due to multiple factors. The Demographic Transition Model (DTM) is a key framework for understanding population growth and changes in birth and death rates.
- The DTM consists of four primary stages, with a recent trend toward recognizing a fifth stage. As a country develops, birth and death rates typically decrease due to improved access to education, healthcare, food supplies, and economic growth.
Why People Move
Push and Pull Factors
- Push and pull factors are terms used to explain the reasons behind migration. Push factors are conditions that compel people to leave their home country, while pull factors are attractions that draw individuals to a new country.
- Common push factors include wars, terrorism, poor economic conditions, and overpopulation. Pull factors, on the other hand, include the desire to reunite with family, access to new job opportunities, and safe living environments that entice people to relocate to another country.
Key Terms
- Agricultural Population Density: This measures the number of farmers per unit of arable land, reflecting the efficiency of agricultural practices and the relationship between population and food production.
- Arithmetic Population Density: This calculates the average number of people per unit area, typically in square miles or kilometers, providing insight into population distribution and resource pressure across regions.
- Demographic Transition Model (DTM): The DTM is a model that outlines the stages of population change, from high birth and death rates to low rates, explaining population growth, migration patterns, and demographic shifts over time.
- Freshwater: Freshwater is water with low salt content, found in rivers, lakes, and aquifers, essential for human survival, agriculture, and ecosystems, influencing settlement and migration patterns.
- Global Birth Rates: Global birth rates measure the number of live births per 1,000 people annually, indicating population growth trends, societal changes, and demographic shifts across regions.
- Human Factors: Human factors encompass social, cultural, economic, and political influences on individual and group behavior, shaping migration, population distribution, and demographic changes.
- Low-Income Developing Countries: These are nations with a GNI per capita of $1,045 or less, facing challenges like poverty, limited healthcare, and infrastructure, driving migration due to difficult living conditions.
- Midlatitudes: Midlatitudes are regions between 30 and 60 degrees north and south of the equator, known for temperate climates and fertile lands, hosting major cities and agricultural areas.
- Physical Factors: Physical factors are natural elements like climate, geography, and resources that influence human settlement, migration, and interactions with the environment.
- Physiological Population Density: This measures the number of people per unit of arable land, indicating how well a region’s agricultural resources can support its population and highlighting resource pressures.
- Population & Migration: Population refers to the total number of people in an area, while migration is their movement between places, impacting social, economic, and cultural dynamics.
- Population Pyramids: These are graphs showing a population’s age and gender distribution, revealing trends in birth rates, death rates, and migration, and indicating socioeconomic challenges.
- Pull Factors: Pull factors are appealing conditions, such as job opportunities, safety, or family connections, that attract migrants to a new location, influencing demographic changes.
- Push Factors: Push factors are adverse conditions, like war, poverty, or environmental issues, that drive people to leave their home regions, shaping migration patterns.
|
30 docs|3 tests
|
FAQs on Population & Migration Chapter Notes - Geography for Grade 9
| 1. What are the main physical factors that influence population distribution? |  |
| 2. How do human factors affect where people live? | |
| 3. What is the difference between arithmetic and physiological population density? | |
| 4. How does the scale of analysis affect the understanding of population distribution? | |
| 5. What are some examples of regions with high and low population densities? | |


Previous Year Questions with Solutions
,MCQs
,practice quizzes
,Summary
,study material
,shortcuts and tricks
,video lectures
,mock tests for examination
,Population & Migration Chapter Notes | Geography for Grade 9
,Free
,Important questions
,Population & Migration Chapter Notes | Geography for Grade 9
,Viva Questions
,Exam
,Sample Paper
,past year papers
,Population & Migration Chapter Notes | Geography for Grade 9
,ppt
,Extra Questions
,Semester Notes
,Objective type Questions
;


Chapter Notes: Population & Migration Free PDF Download
Importance of Chapter Notes: Population & Migration
Chapter Notes: Population & Migration
Chapter Notes: Population & Migration Grade 9 Questions
Study Chapter Notes: Population & Migration on the App
|
© EduRev
|
Education Revolution
|


|


