Worksheet Solutions: Data Handling

Q1. Grade 8 students recorded the colours of cars that drove by their school over a five minute period. Each car picture = 1 car. 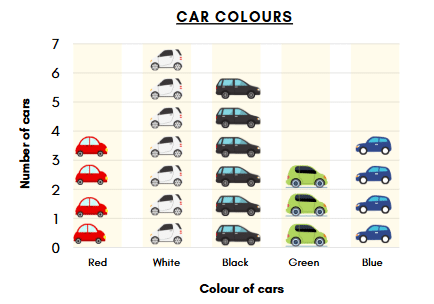
Complete the following questions:
a) What colour car was the most popular?
Ans: The white column has the most car pictures - there are 7 white cars.
b) What colour car was recorded six (6) times?
Ans: There are 6 black cars.
So, the colour recorded six times is black.
c) What is the total number of red and white cars recorded?
Ans: First, count the red cars - there are 4.
Then count the white cars - there are 7.
To find the total, we add:
4 (red) + 7 (white) = 11
So, there were 11 red and white cars altogether.
Q2. In a class, children were asked about their favourite fruits. Each fruit symbol in the chart below represents one child's choice. The chart shows how many children liked each type of fruit - bananas, apples, oranges, avocados, and pears.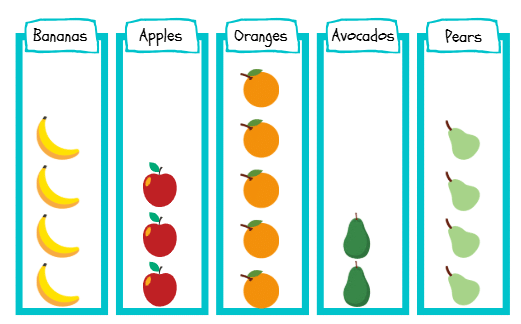
a) How many children like pear?
Ans: There are 4 pear pictures, so 4 children like pears.
b) Which fruit do children like the most?
Ans: There are 5 oranges in the chart, which is the highest number. So, most children like oranges.
c) Which fruit do children like the least?
Ans: Only 2 children chose avocados, which is the smallest number.
Q3. The bar graph shows how many students liked different school subjects: Math, Science, Sport, History, and STEM (Science, Technology, Engineering, and Math). Each bar's height tells us the number of students who liked that subject.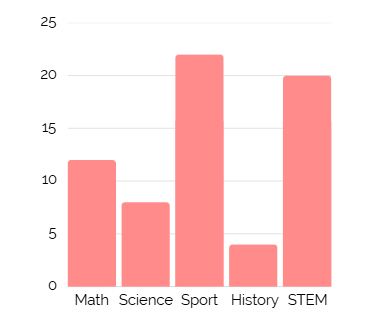
a) How many liked STEM?
Ans: The graph shows 20 students liked STEM.
So the answer is 20.
b) What was the least preferred subject?
Ans: The shortest bar is for History, with only 4 students.
So, History was the least preferred subject.
c) How many students were surveyed altogether?
Ans: Let's add the number of students for each subject:
Math: 12
Science: 8
Sport: 22
History: 4
STEM: 20
Total = 12 + 8 + 22 + 4 + 20 = 66
So, 66 students were surveyed in total.
Q4. The following pictograph shows the number of pet animals sold in a month -
Each symbol = 5 pets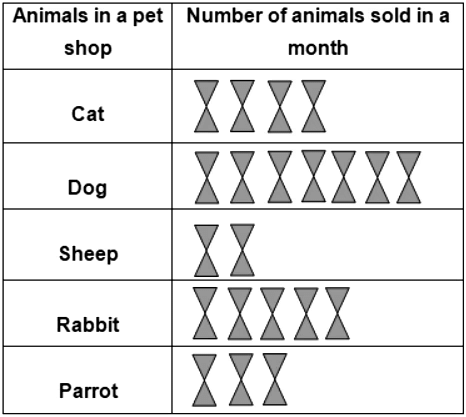
(i) How many more Cats were sold as compared to Sheep ?
(a) 25
(b) 10
(c) 20
Ans: (b)
Given that each symbol = 5 pets
So, the number of Cats sold = ( 5 x 4 ) = 20
The number of Sheep sold = ( 5 x 2 ) = 10
Number of Cats sold more as compared to Sheep = The number of Cats sold - The number of Sheep sold
= 20 - 10 = 10
(ii) How many Parrots were sold in a month?
(a) 16
(b) 15
(c) 10
Ans: (b)
Given that each symbol = 5 pets
So, the number of Parrots sold = (5 x 3) = 15
(iii) Which pet was sold the most ?
(a) Parrot
(b) Rabbit
(c) Dog
Ans: (c)
Since there are maximum number of symbols for Dog, Dog is sold the most in a month.
(iv) How many Dogs were sold in a month ?
(a) 35
(b) 55
(c) 30
Ans: (a)
Given that each symbol = 5 pets
So, the number of Dogs sold =( 5 x 7 )
= 35
(v) Which pet was sold the least ?
(a) Dog
(b) Cat
(c) Sheep
Ans: (c)
Since there are minimum number of symbols for sheep, therefore Sheep were sold the least.
Q5. The total number of animals in five villages are given below: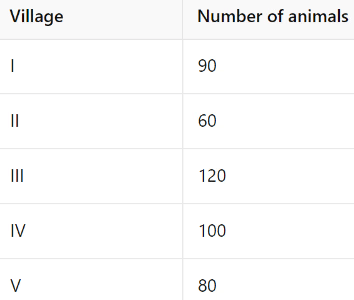
Draw a pictograph to represent the above data.
Ans: Each circle represents 10 animals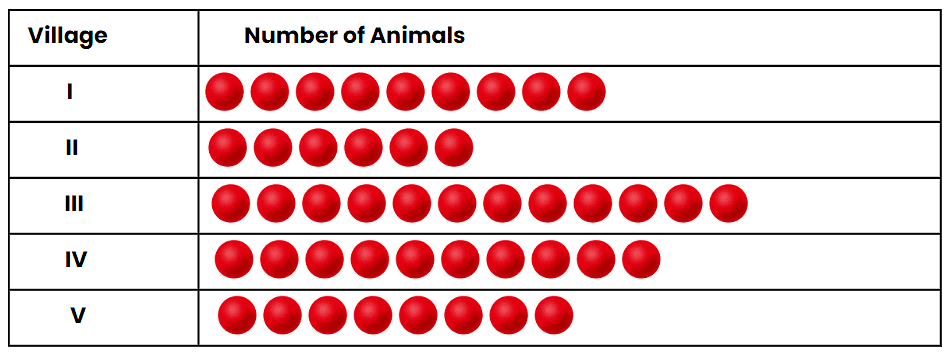
FAQs on Worksheet Solutions: Data Handling
| 1. What is data handling in the context of Class 4? |  |
| 2. Why is data handling important for Class 4 students? | |
| 3. What types of graphs are commonly used in Class 4 data handling? | |
| 4. How can students collect data for their projects in Class 4? | |
| 5. What are some fun activities to teach data handling to Class 4 students? | |